Full Report
The numbers behind Alcoa Corporation: as-reported financial statements and company metrics for FY2021–FY2025, traced to the source filings, opened with the share-price history those statements have to justify. Every linked figure opens the exact page of the filing it was printed on, with the statement row highlighted. Amounts in US$ millions unless noted.
Reading notes: All figures are in US$ millions as printed in Alcoa's Form 10-K statements ('in millions, except per-share amounts'); per-share amounts, production volumes and realized prices are as printed and are exempt from that scale. FY2021-FY2025 statement figures are each taken from that year's own Form 10-K, where the year is the left-hand column. FY2016-FY2018 long-term figures come from the standardized data feed (SEC XBRL) and carry no page links; FY2019-FY2020 are linked to the comparative columns of the FY2021 Form 10-K. The Sales by product division table labels the largest division 'Primary aluminum' in the FY2021-FY2023 Forms 10-K and 'Aluminum' from the FY2024 Form 10-K onward; the row is shown as 'Aluminum' and each year's quote preserves the label as printed. Flat-rolled aluminum represented the Warrick Rolling Mill, sold in March 2021; the line is printed as a dash from FY2022 and is dropped from the table entirely in the FY2024 and FY2025 Forms 10-K, so those cells are left blank.
Share Price — Full Available History — 37 Years
The stock closed at $45.26 on Jul 31, 2026 — up 609% over the window shown (+5.5% a year), trading between $4.27 and $255.92. At that close the stock trades at 10× FY2025 diluted EPS as reported below.
Source: market price feed, monthly closes, sampled from 9,213 source observations, Jan 1990–Jul 2026. Price return only, excludes dividends. Prices are split-adjusted (1:2 on Feb 27, 1995; 1:2 on Feb 26, 1999; 1:2 on Jun 12, 2000; ×0.333333 on Oct 06, 2016; ×1.24844 on Nov 01, 2016).
Market capitalization $11.8bn and enterprise value $12.7bn.
Market cap = 261.0M shares outstanding × the Jul 31, 2026 close of $45.26. Enterprise value adds total debt of $2.4bn and subtracts cash and equivalents of $1.6bn (net debt of $842mn), from the FY2025 balance sheet. Market-derived figures, shown without filing links.
FY2025 at a Glance
Net income (US$ millions)
Diluted EPS
Source: FY2025 consolidated statements [1] [2] [3] [4]. Click any linked figure to open the filing page with the row highlighted.
Sales by Product Division
| Sales by Product Division | FY2021 | FY2022 | FY2023 | FY2024 | FY2025 |
|---|---|---|---|---|---|
| Aluminum | 8,420 | 8,887 | 7,045 | 7,359 | 8,515 |
| Alumina | 3,125 | 3,478 | 3,103 | 4,246 | 3,662 |
| Bauxite | 207 | 168 | 466 | 376 | 727 |
| Energy | 286 | 201 | 118 | 147 | 190 |
| Flat-rolled aluminum | 320 | 0 | 0 | — | — |
| Other | (206) | (283) | (181) | (233) | (263) |
| Total sales | 12,152 | 12,451 | 10,551 | 11,895 | 12,831 |
Source: Form 10-K Note E — Segment and Geographic Area Information, Sales by product division; total agrees to the Statement of Consolidated Operations [5] [1] [6] [2]. Click any linked figure to open the filing page with the row highlighted.
Segment Adjusted EBITDA
| Segment Adjusted EBITDA | FY2021 | FY2022 | FY2023 | FY2024 | FY2025 |
|---|---|---|---|---|---|
| Alumina | — | 788 | 273 | 1,408 | 882 |
| Aluminum | — | 1,492 | 461 | 657 | 1,058 |
| Total Segment Adjusted EBITDA | — | 2,280 | 734 | 2,065 | 1,940 |
Source: Form 10-K Note E — reportable segment operating results (Alumina and Aluminum). FY2022 is the recast two-segment presentation from the FY2024 Form 10-K; FY2021 predates the recast and is not shown [7] [8]. Click any linked figure to open the filing page with the row highlighted.
Income Statement
Source: Statement of Consolidated Operations [1] [2] [3] [4]. Click any linked figure to open the filing page with the row highlighted.
Columns marked E are consensus analyst estimates from S&P Capital IQ (CapIQ), shown alongside reported results for direct comparison; they are not company guidance.
Estimate source: S&P Capital IQ (CapIQ) consensus, as of 2026-08-03. Estimate figures are S&P Capital IQ consensus (vendor data — no filing page links). EPS and net income use the normalized (adjusted) consensus where the street reports it. Line-item analyst models (segments, drivers, KPIs) are in the Visible Alpha tab.
Balance Sheet
Source: Consolidated Balance Sheet [9] [10] [11] [12]. Click any linked figure to open the filing page with the row highlighted.
Cash Flow
Source: Statement of Consolidated Cash Flow [13] [14] [15] [16]. Click any linked figure to open the filing page with the row highlighted.
Alumina Bauxite — Operating Data
| Alumina Bauxite — Operating Data | FY2021 | FY2022 | FY2023 | FY2024 | FY2025 |
|---|---|---|---|---|---|
| Bauxite production (mdmt) | 47.6 | 42.1 | 41.0 | 38.3 | 37.5 |
| Alumina production (kmt) | 13,259 | 12,544 | 10,908 | 10,034 | 9,640 |
| Third-party alumina shipments (kmt) | 9,629 | 9,169 | 8,698 | 9,005 | 8,829 |
| Realized third-party alumina price ($/tonne) | 326.00 | 384.00 | 358.00 | 472.00 | 415.00 |
| Adjusted operating cost per tonne of alumina shipped ($) | — | — | — | 309.00 | 317.00 |
Source: company filings [17] [18] [19] [20]. Click any linked figure to open the filing page with the row highlighted.
Aluminum — Operating Data
| Aluminum — Operating Data | FY2021 | FY2022 | FY2023 | FY2024 | FY2025 |
|---|---|---|---|---|---|
| Aluminum production (kmt) | 2,193 | 2,010 | 2,114 | 2,215 | 2,319 |
| Total aluminum shipments (kmt) | 2,949 | 2,570 | 2,491 | 2,590 | 2,522 |
| Realized third-party aluminum price ($/tonne) | 2,879.00 | 3,457.00 | 2,828.00 | 2,841.00 | 3,376.00 |
| Adjusted operating cost per tonne of aluminum shipped ($) | — | — | — | 2,410.00 | 2,600.00 |
Source: company filings [21] [22] [23] [24]. Click any linked figure to open the filing page with the row highlighted.
Capacity Curtailment (year-end)
| Capacity Curtailment (year-end) | FY2021 | FY2022 | FY2023 | FY2024 | FY2025 |
|---|---|---|---|---|---|
| Total consolidated smelting capacity (mtpy) | 2,962,000 | 2,968,000 | 2,645,000 | 2,645,000 | 2,645,000 |
| Idle smelting capacity (mtpy) | 685,000 | 868,000 | 465,000 | 374,000 | 196,000 |
| Total consolidated alumina refining capacity (mtpy) | 13,843,000 | 13,843,000 | 13,843,000 | 13,843,000 | 11,653,000 |
| Idle alumina refining capacity (mtpy) | 214,000 | 1,014,000 | 1,452,000 | 3,204,000 | 1,014,000 |
Source: company filings [25] [26] [27] [28]. Click any linked figure to open the filing page with the row highlighted.
Long-Term Record
| Fiscal year | Sales | Net income (loss) attributable to Alcoa Corporation | Diluted earnings per share | Cash provided from operations | Capital expenditures |
|---|---|---|---|---|---|
| FY2016 | 9,318 | (400) | (2.19) | (311) | (404) |
| FY2017 | 11,652 | 279 | 1.49 | 1,224 | (405) |
| FY2018 | 13,403 | 250 | 1.33 | 448 | (399) |
| FY2019 | 10,433 | (1,125) | (6.07) | 686 | (379) |
| FY2020 | 9,286 | (170) | (0.91) | 394 | (353) |
| FY2021 | 12,152 | 429 | 2.26 | 920 | (390) |
| FY2022 | 12,451 | (123) | (0.68) | 822 | (480) |
| FY2023 | 10,551 | (651) | (3.65) | 91 | (531) |
| FY2024 | 11,895 | 60 | 0.26 | 622 | (580) |
| FY2025 | 12,831 | 1,157 | 4.37 | 1,185 | (618) |
Source: consolidated statements across filings; older years from the standardized feed [13] [1] [14] [2]. Click any linked figure to open the filing page with the row highlighted.
Operating KPIs
| KPI | FY2021 | FY2022 | FY2023 | FY2024 | FY2025 |
|---|---|---|---|---|---|
| Bauxite production (mdmt) | 47.6 | 42.1 | 41.0 | 38.3 | 37.5 |
| Alumina production (kmt) | 13,259 | 12,544 | 10,908 | 10,034 | 9,640 |
| Aluminum production (kmt) | 2,193 | 2,010 | 2,114 | 2,215 | 2,319 |
| Average realized third-party price per metric ton of alumina (US$) | 326 | 384 | 358 | 472 | 415 |
| Average realized third-party price per metric ton of aluminum (US$) | 2,879 | 3,457 | 2,828 | 2,841 | 3,376 |
Source: company-reported operating metrics [21] [17] [22] [18]. Click any linked figure to open the filing page with the row highlighted.
Analyst Consensus
Mean target
Median target
High target
Low target
Street ratings: 7 strong buy, 5 hold, 1 sell. Consensus: Buy.
Estimate source: S&P Capital IQ (CapIQ) consensus, as of 2026-08-03. Estimate figures are S&P Capital IQ consensus (vendor data — no filing page links). EPS and net income use the normalized (adjusted) consensus where the street reports it. Line-item analyst models (segments, drivers, KPIs) are in the Visible Alpha tab.
Traceability
468 of 485 figures on this page (96%) link to the filing page where they are printed — click a linked figure to open the source PDF at that page with the row highlighted. Unlinked figures come from standardized data feeds or pre-filing years.
All figures are in US$ millions as printed in Alcoa's Form 10-K statements ('in millions, except per-share amounts'); per-share amounts, production volumes and realized prices are as printed and are exempt from that scale.
FY2021-FY2025 statement figures are each taken from that year's own Form 10-K, where the year is the left-hand column. FY2016-FY2018 long-term figures come from the standardized data feed (SEC XBRL) and carry no page links; FY2019-FY2020 are linked to the comparative columns of the FY2021 Form 10-K.
The Sales by product division table labels the largest division 'Primary aluminum' in the FY2021-FY2023 Forms 10-K and 'Aluminum' from the FY2024 Form 10-K onward; the row is shown as 'Aluminum' and each year's quote preserves the label as printed.
Flat-rolled aluminum represented the Warrick Rolling Mill, sold in March 2021; the line is printed as a dash from FY2022 and is dropped from the table entirely in the FY2024 and FY2025 Forms 10-K, so those cells are left blank.
Alcoa moved from three reportable segments (Bauxite, Alumina, Aluminum) to two (Alumina, Aluminum) in the FY2024 Form 10-K, which recast FY2022 and FY2023. Segment Adjusted EBITDA is therefore shown on the two-segment basis from FY2022; FY2021 is not restated in any filing in this corpus and is left blank.
Balance sheet: the FY2024 acquisition of Alumina Limited eliminated the AWAC noncontrolling interest, and from the FY2025 Form 10-K the remaining noncontrolling interest is classified in mezzanine equity, so 'Total equity' for FY2025 is Alcoa shareholders' equity only and is not directly comparable with FY2021-FY2023.
The FY2025 Form 10-K cash flow statement no longer prints a 'Repurchase of common stock' line (no buybacks since 2022), so that cell is blank rather than zero.
Bauxite production for FY2021 and FY2022 is the Bauxite segment's Production (mdmt) as printed in those Forms 10-K; from FY2023 it is printed as 'Bauxite production (mdmt)' inside the Alumina segment table. The measure is the same mine production figure.
Quarterly cash flows are derived from printed year-to-date statements and reconcile exactly to the single-quarter figures Alcoa prints in its free cash flow reconciliation slides (1Q25 75, 2Q25 488, 3Q25 85, 4Q25 537, 1Q26 (179), 2Q26 608) and to data/financials/cash_flow_quarterly.json.
3 figure(s) differed between the data feed and the filing; the filing value is shown (see the run's metrics/metrics_tab.json for the audit trail).
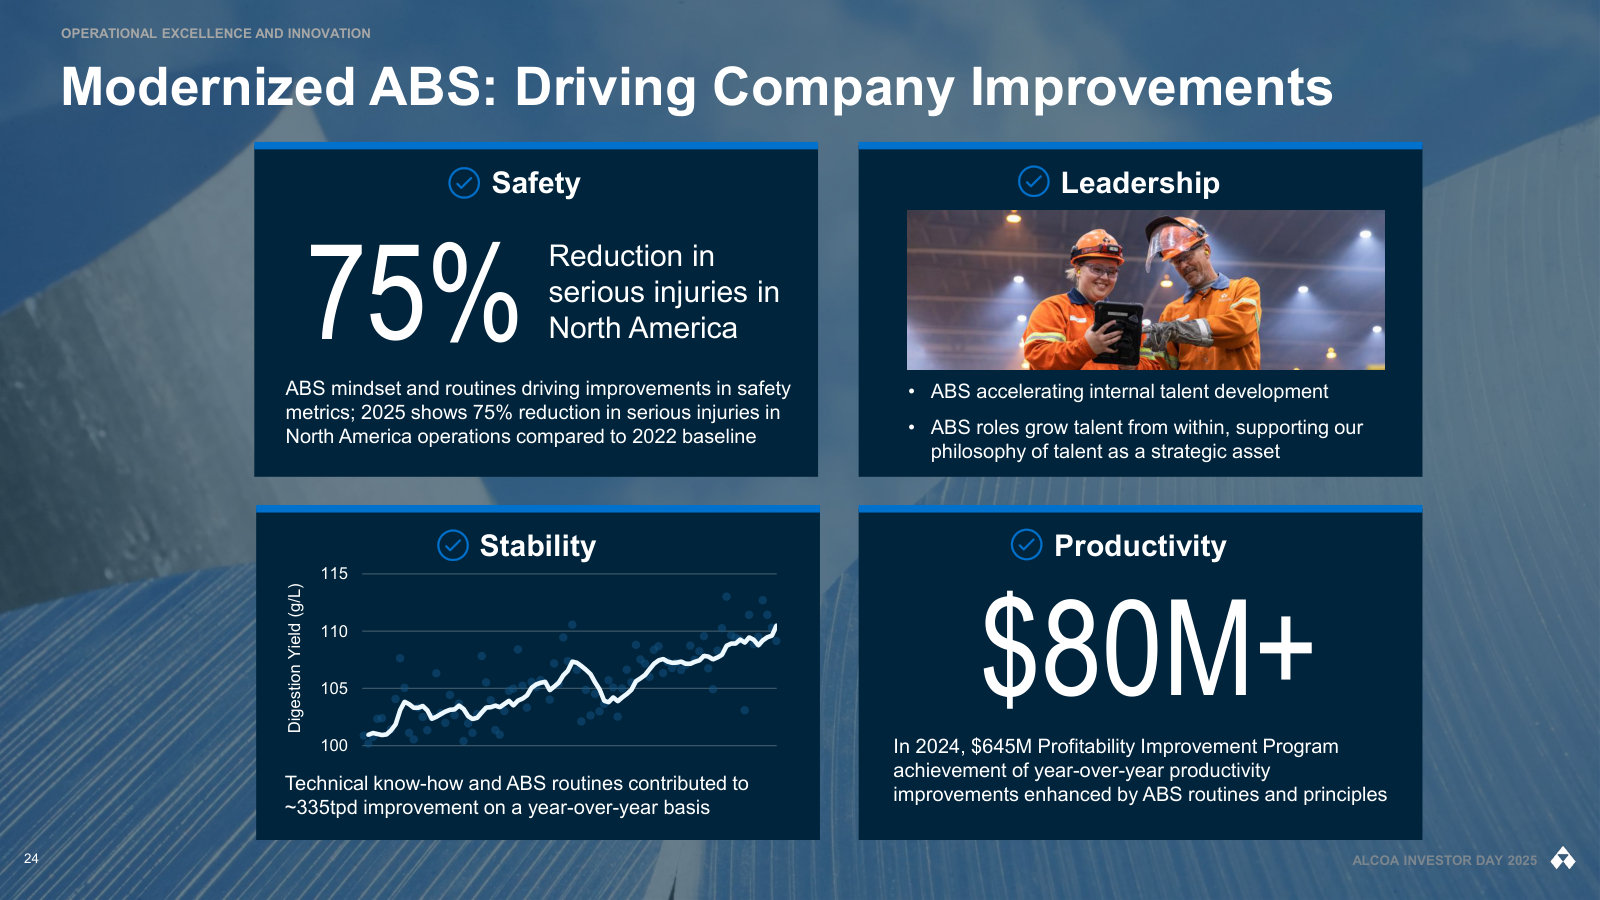
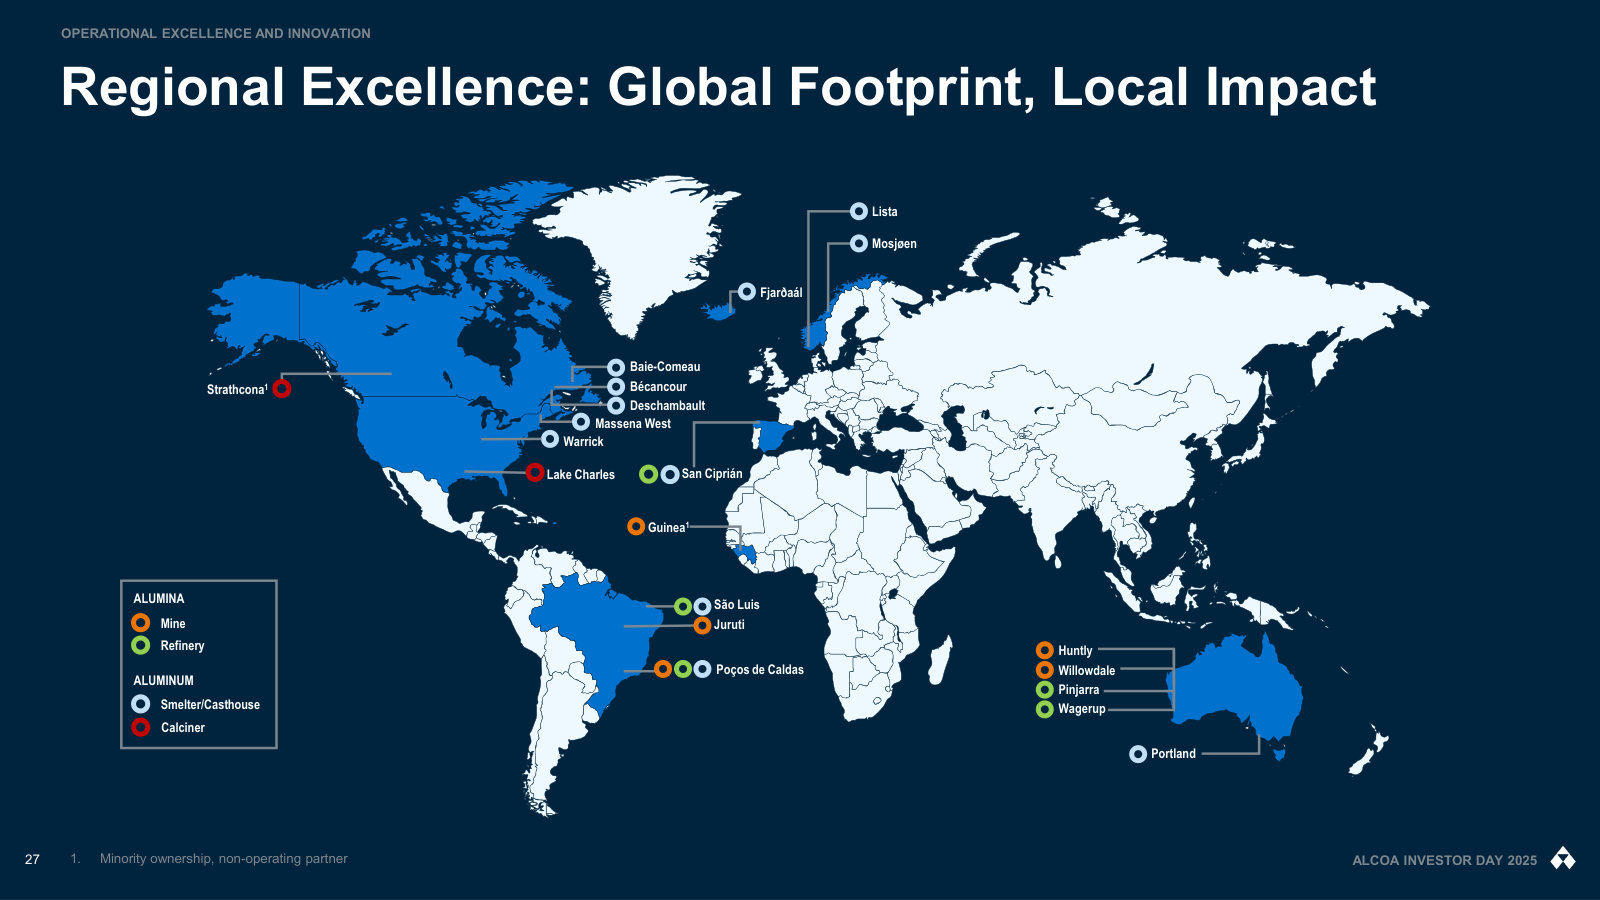
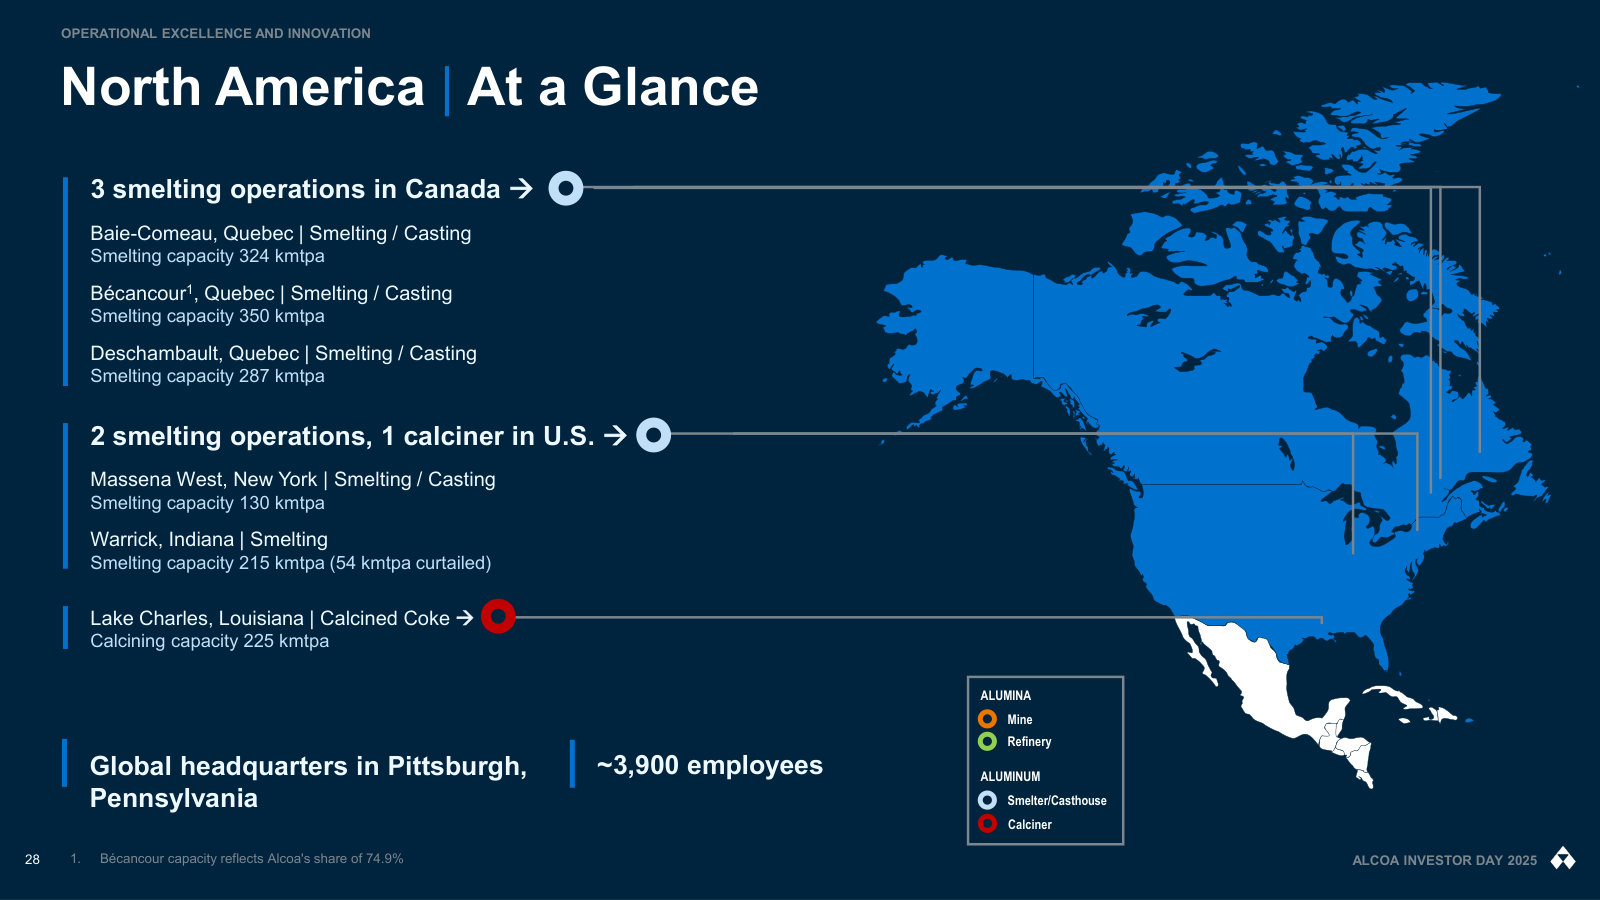
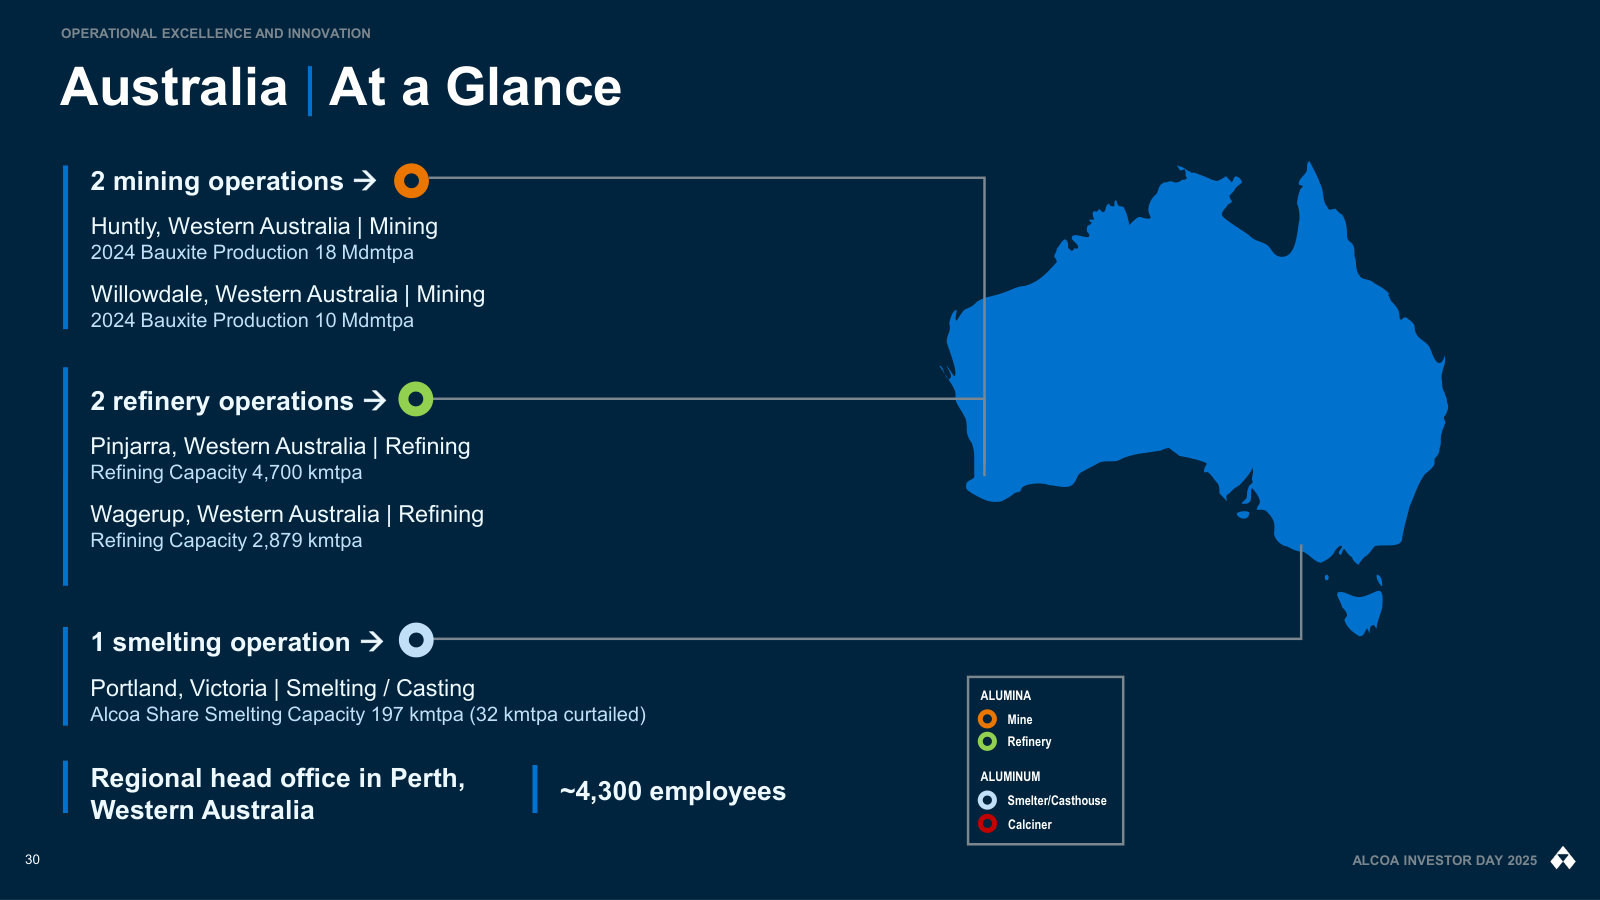
Alcoa Corporation's management explains the business in its own materials. The slides below do the most of that work, pulled from the documents preserved in Sources. Each source link opens the complete presentation at that slide in a new tab.
Investor Day 2025 — 2025
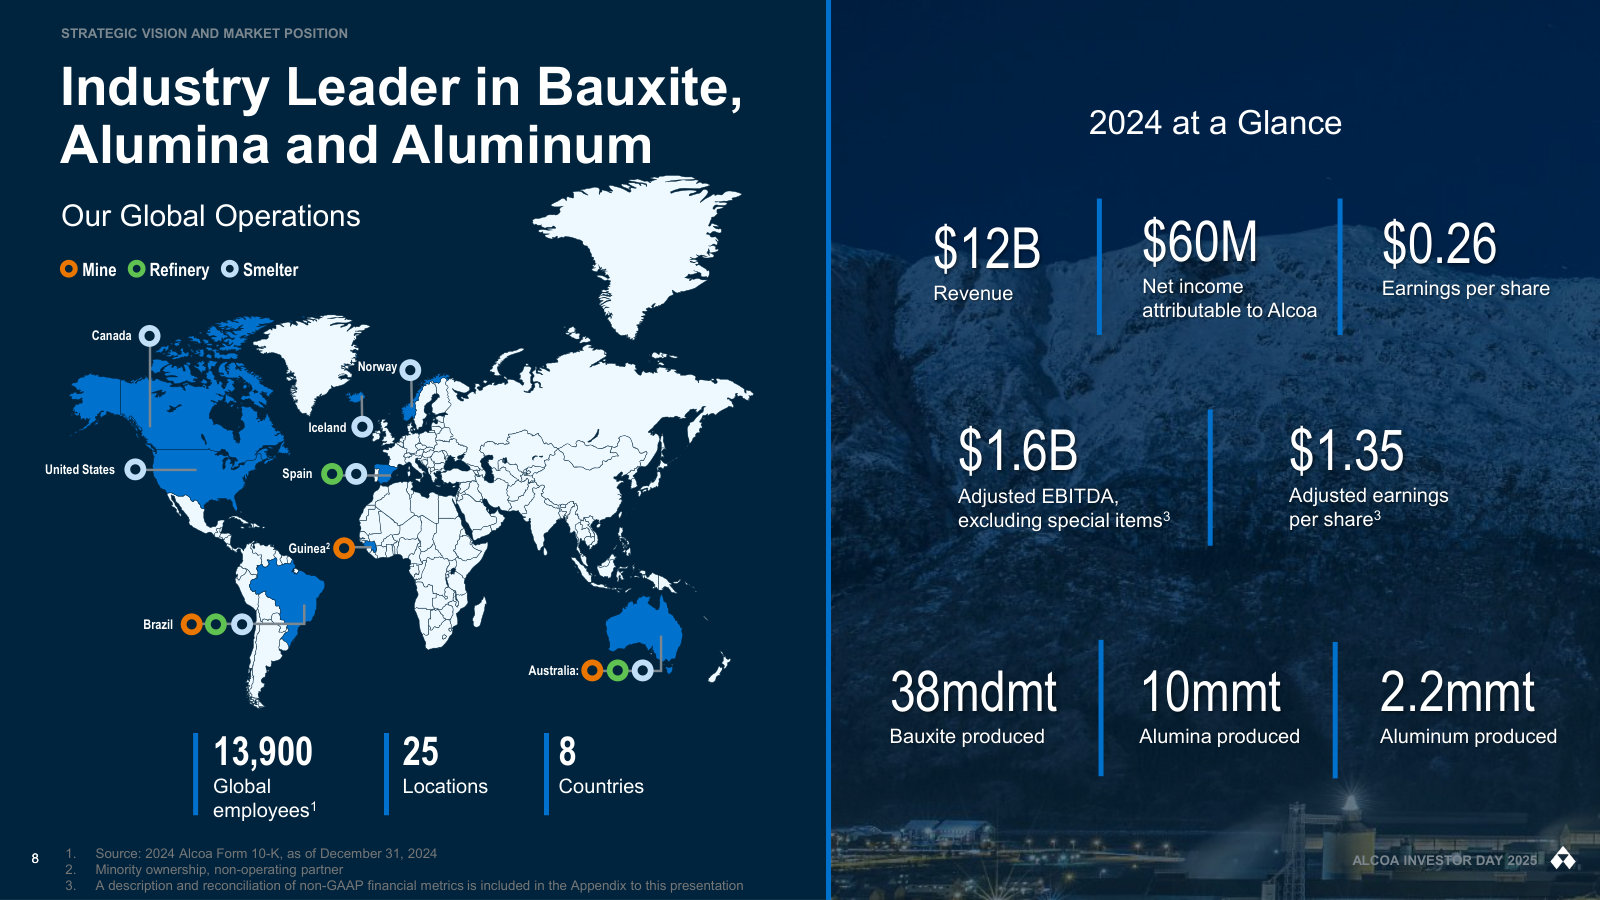
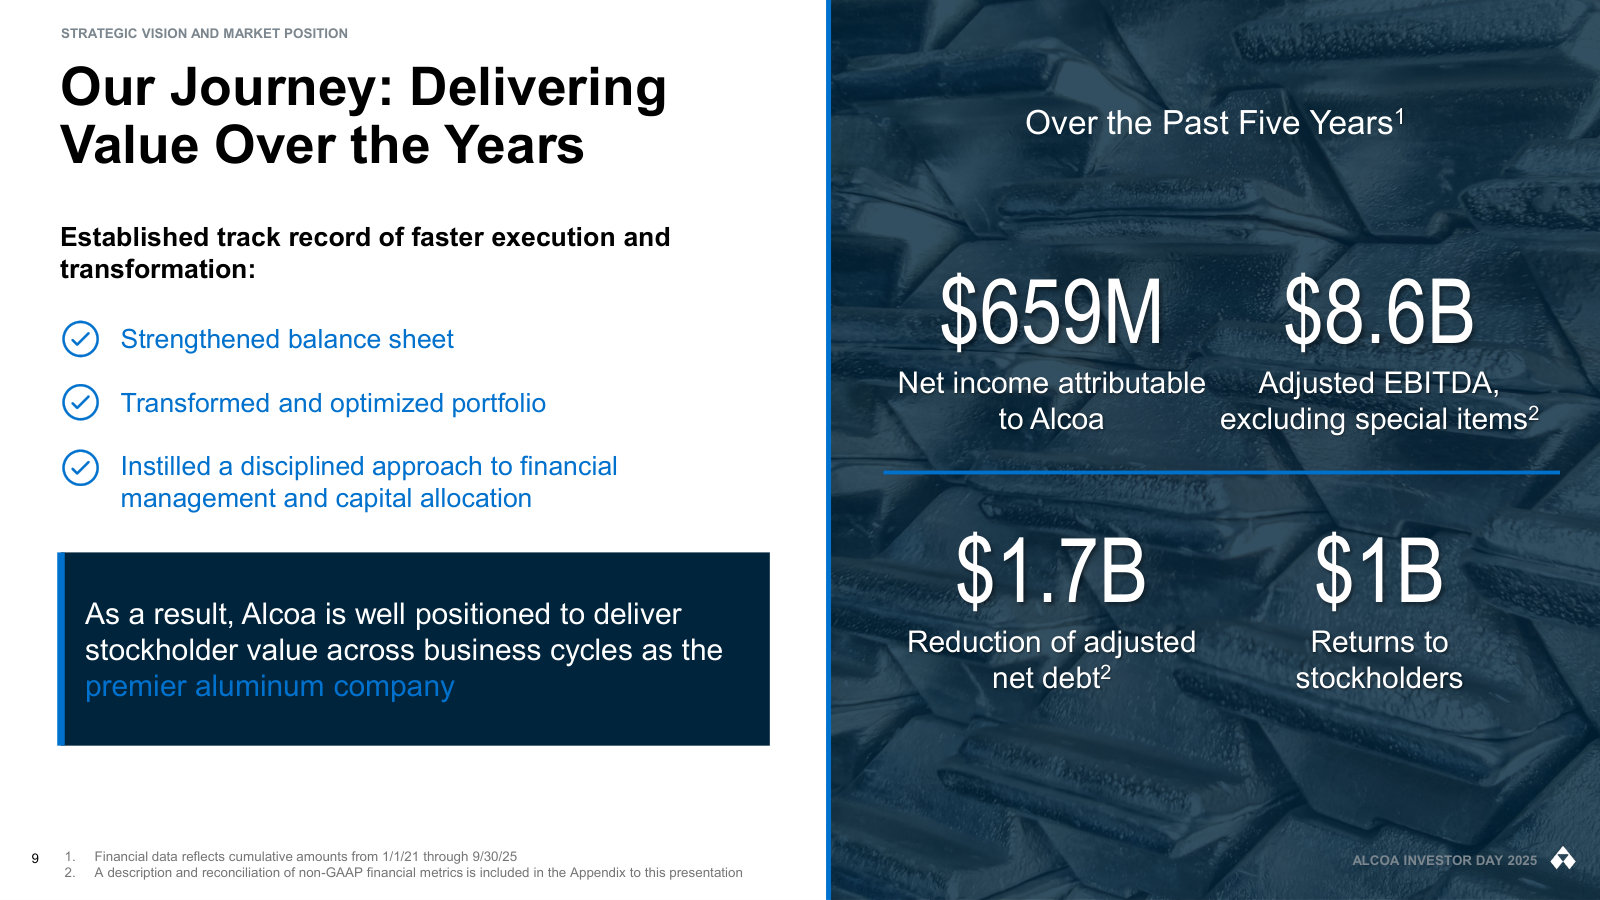
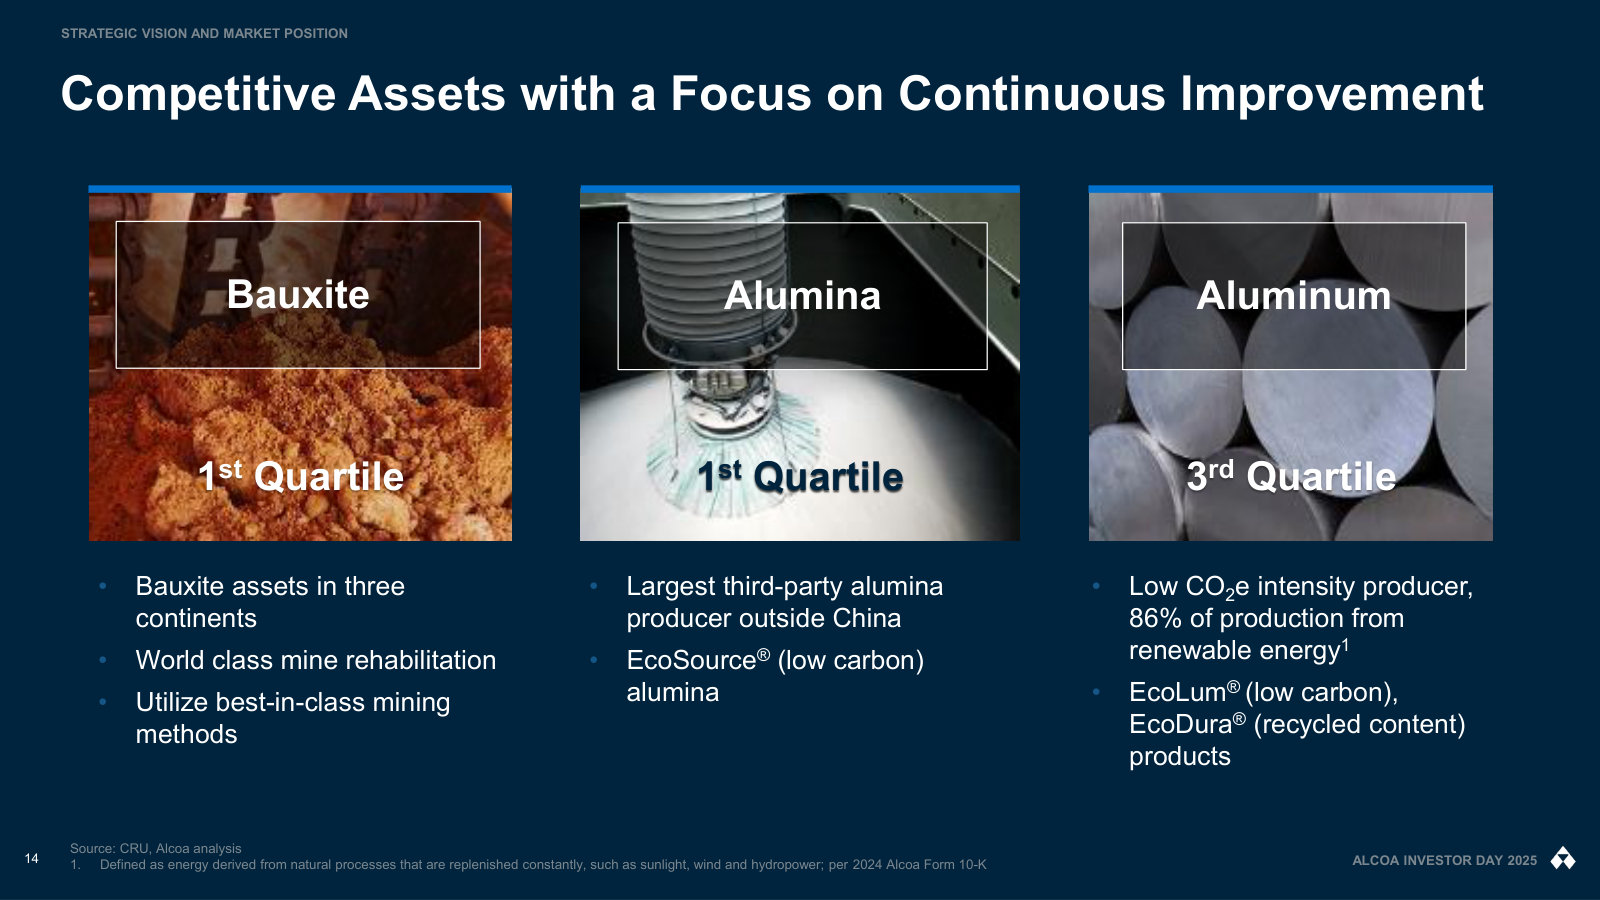
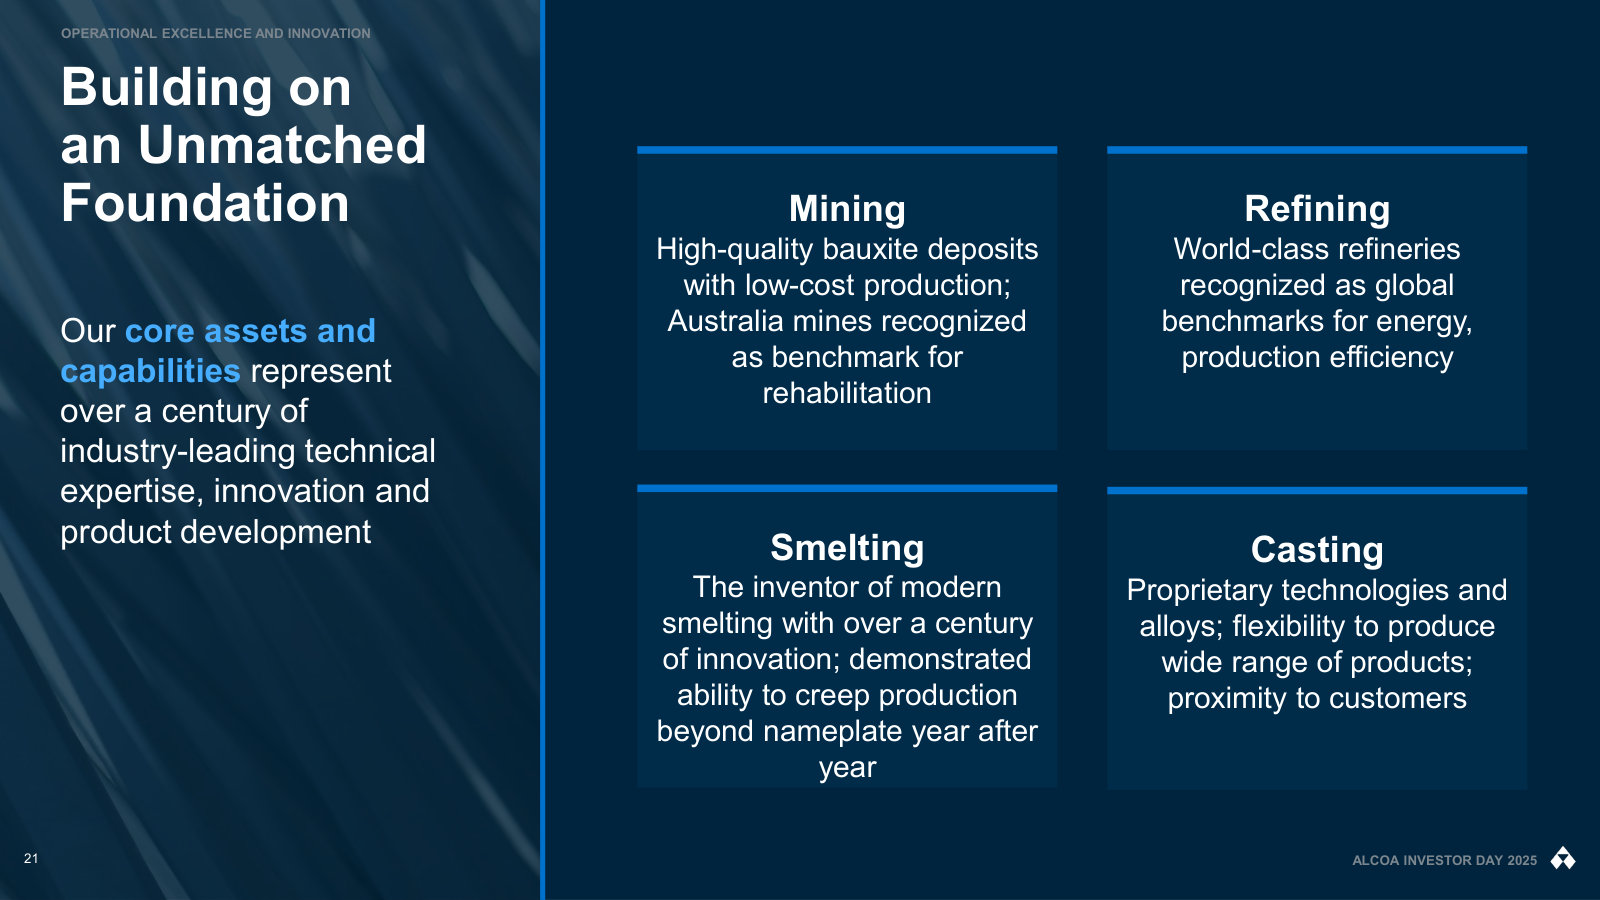
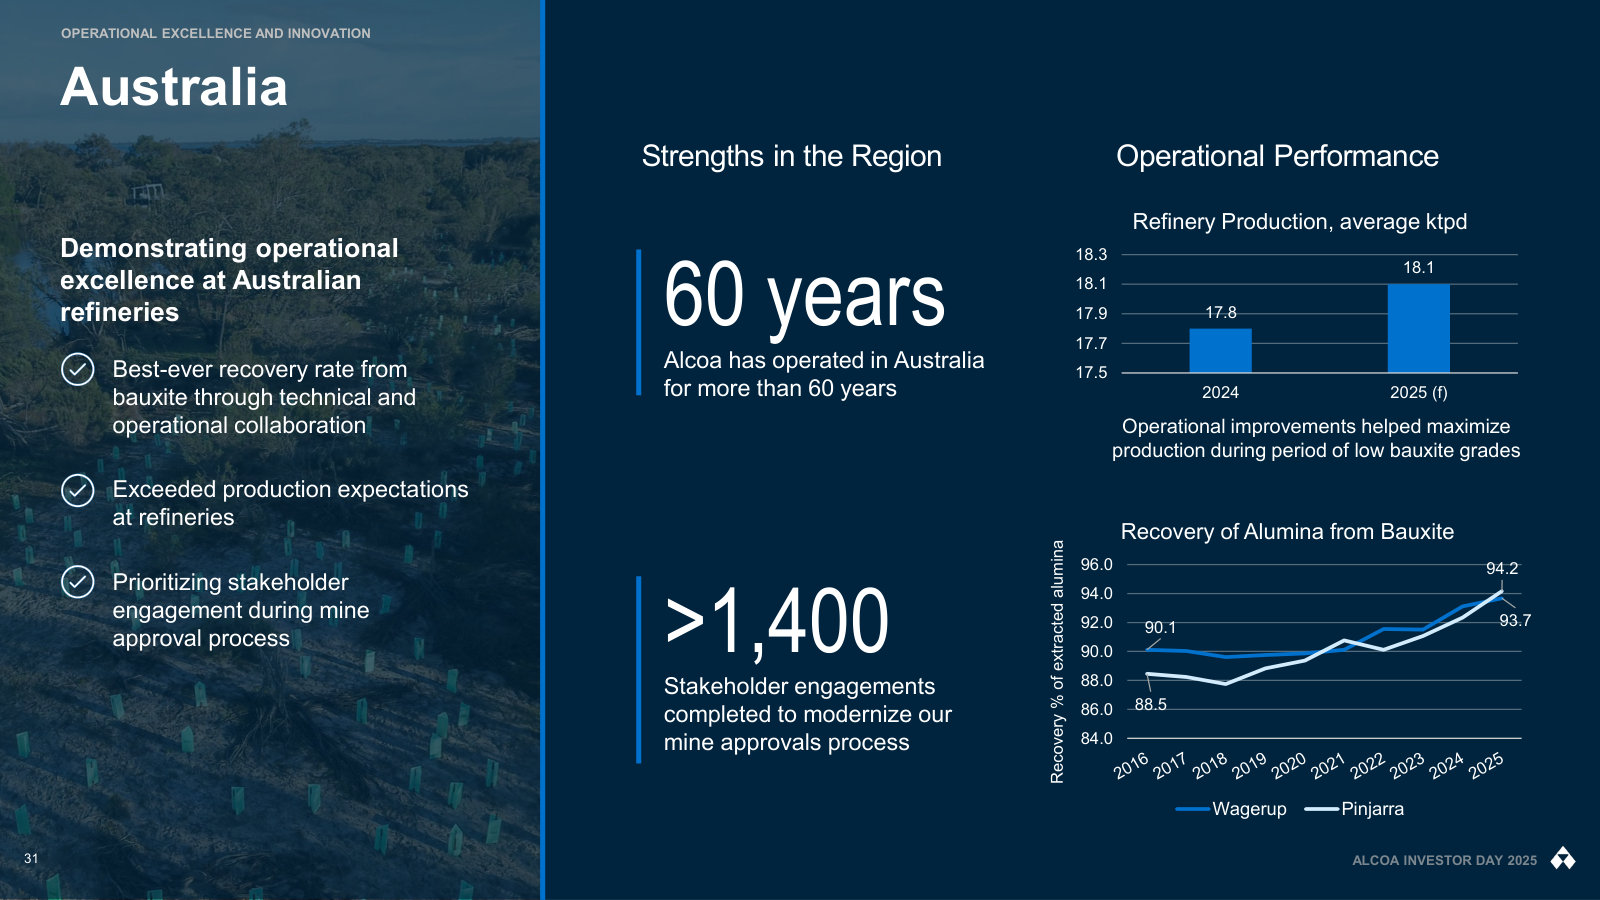
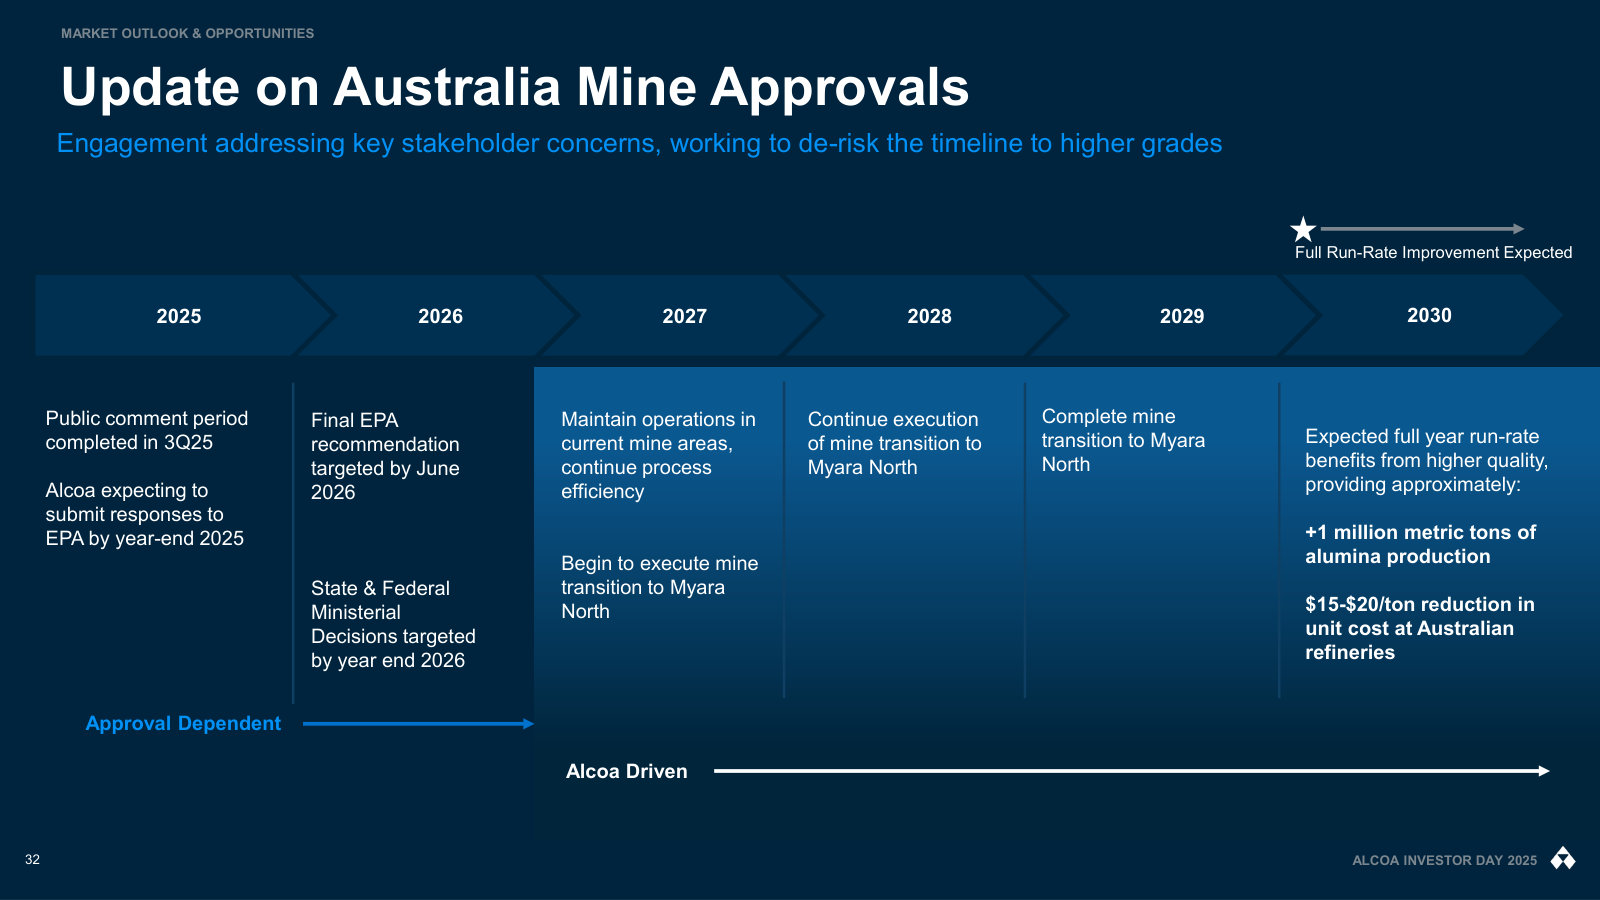
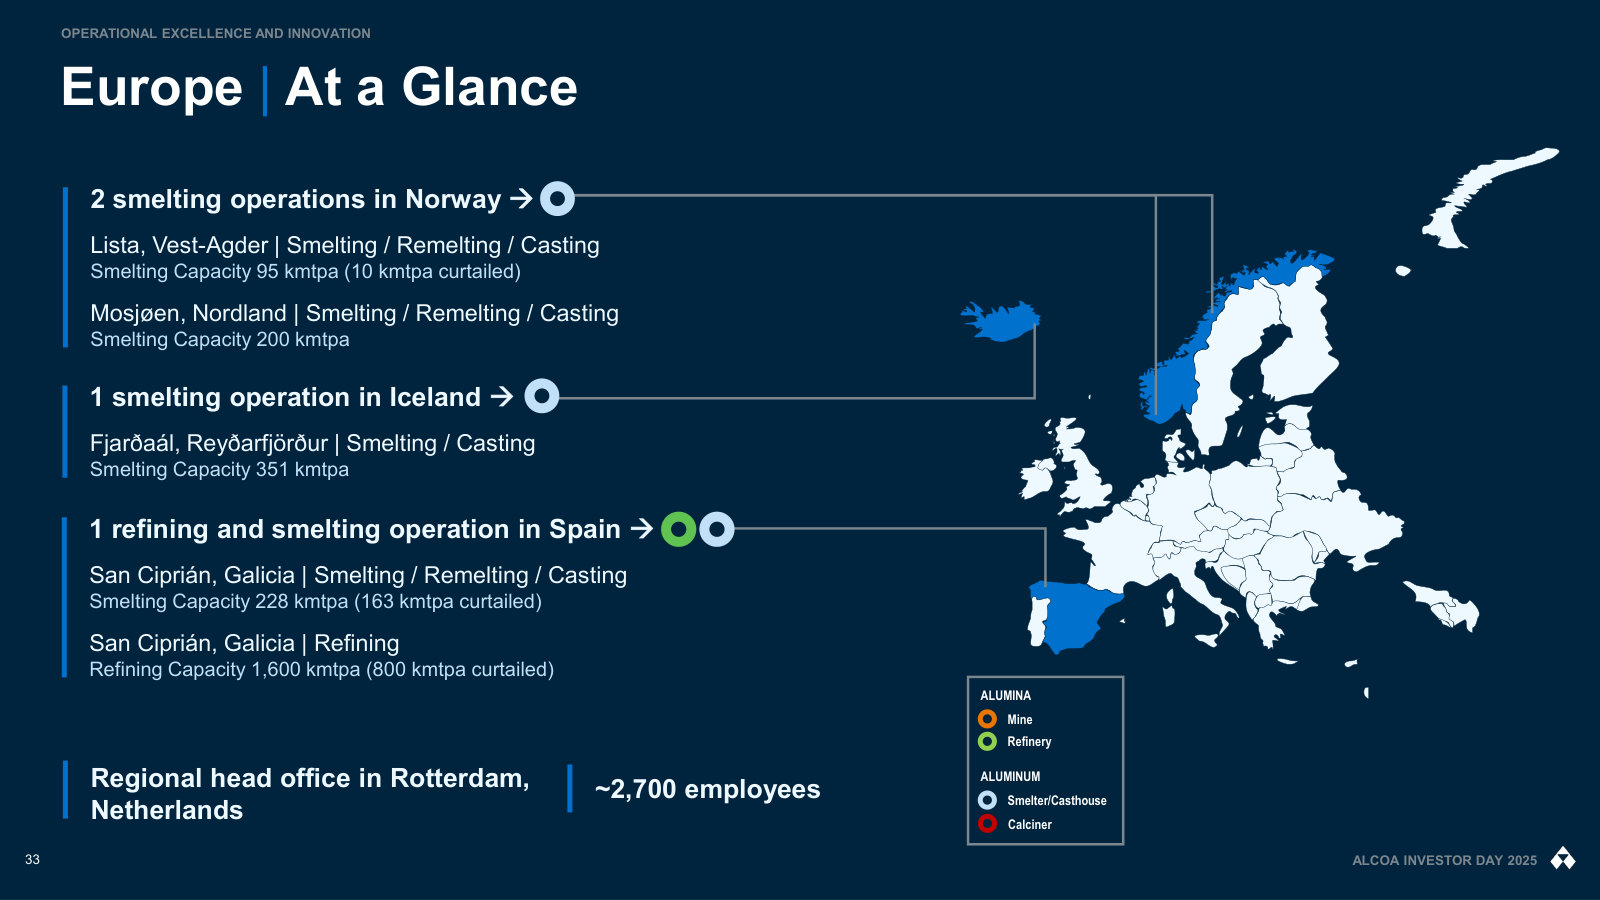
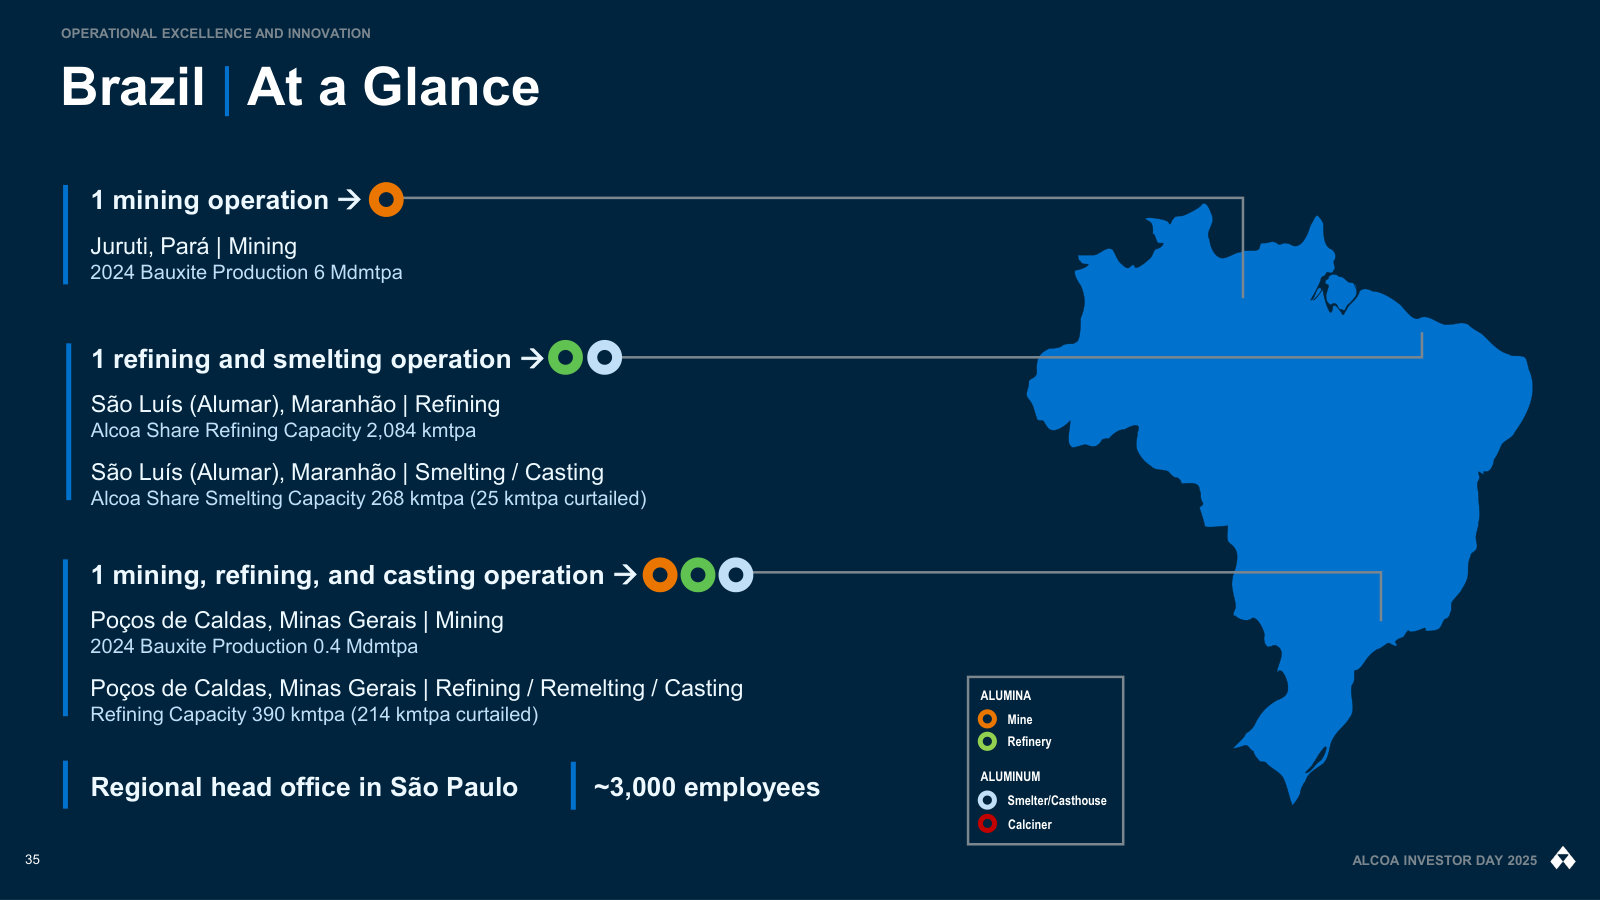
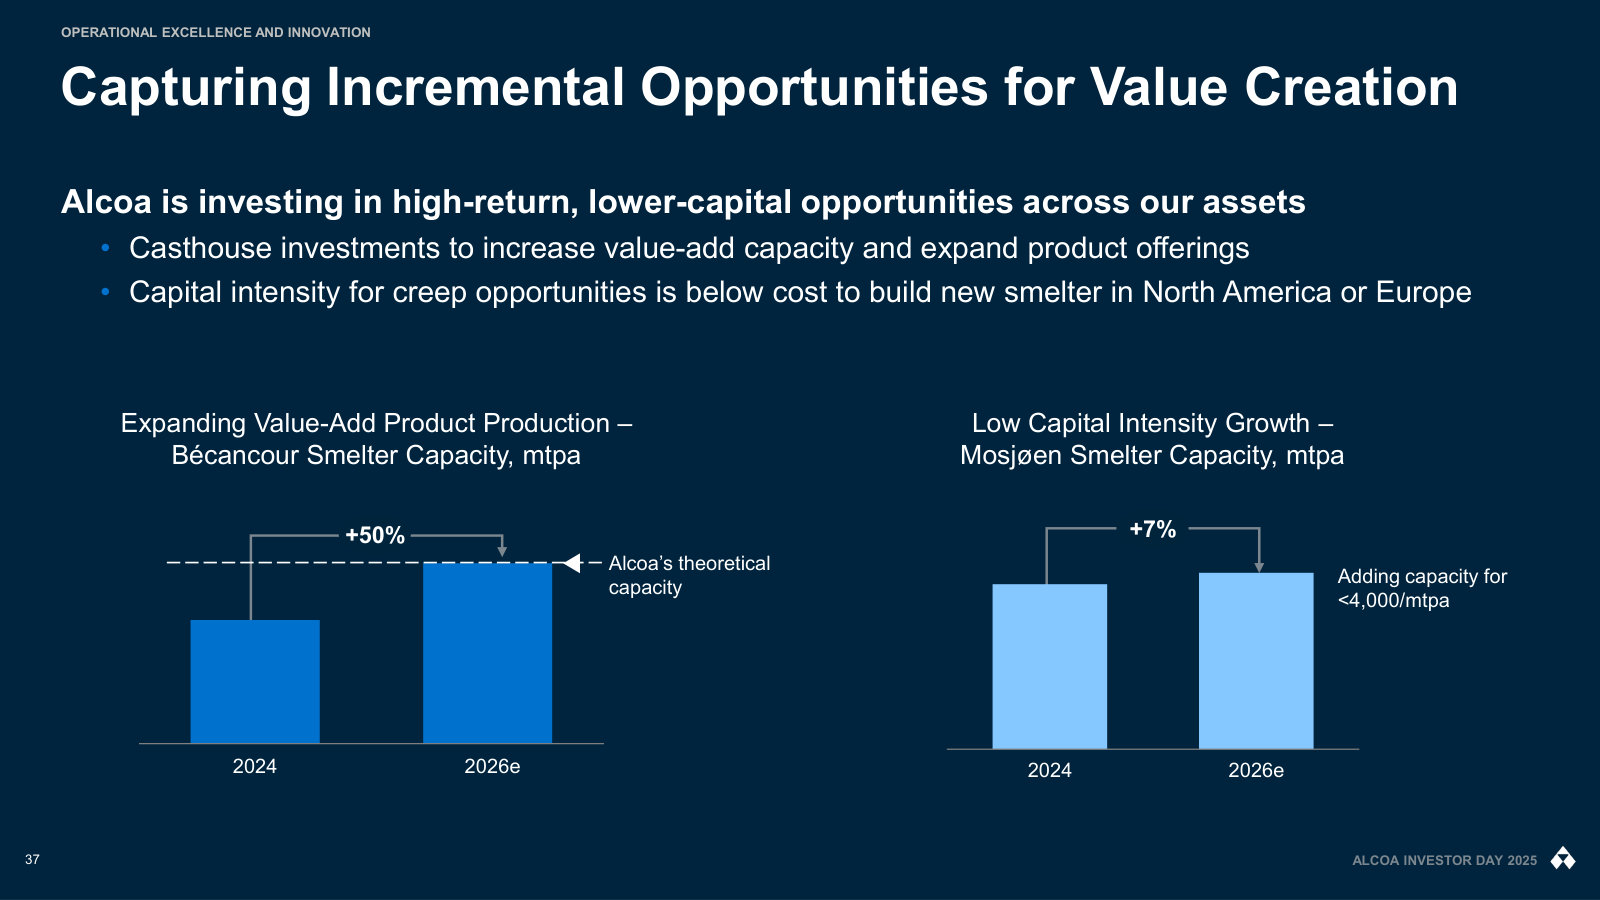
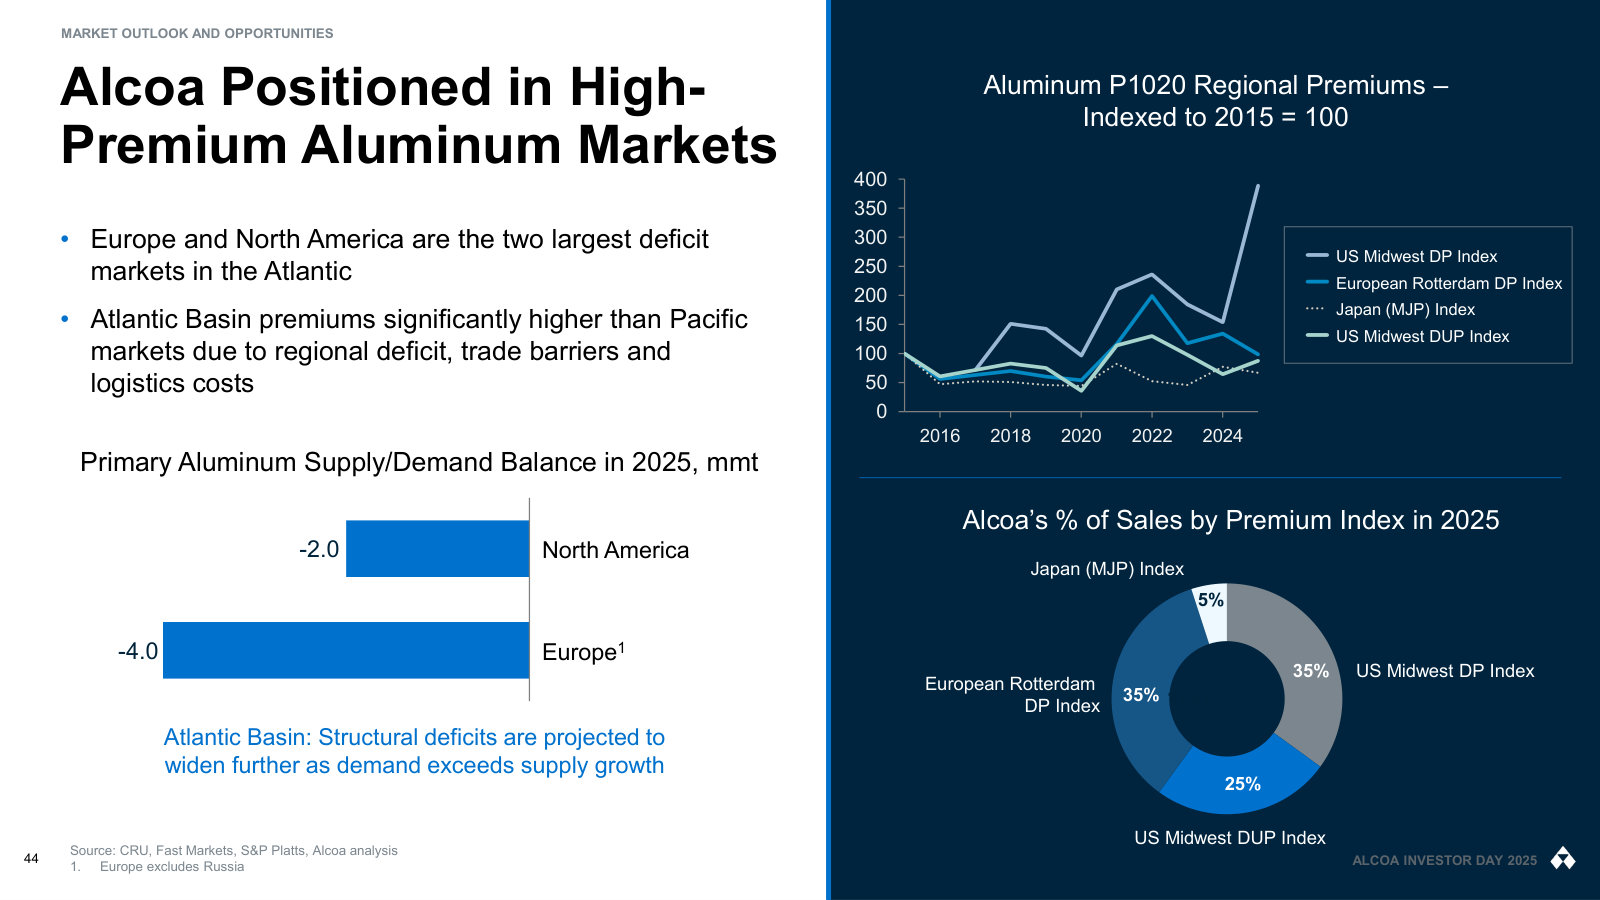
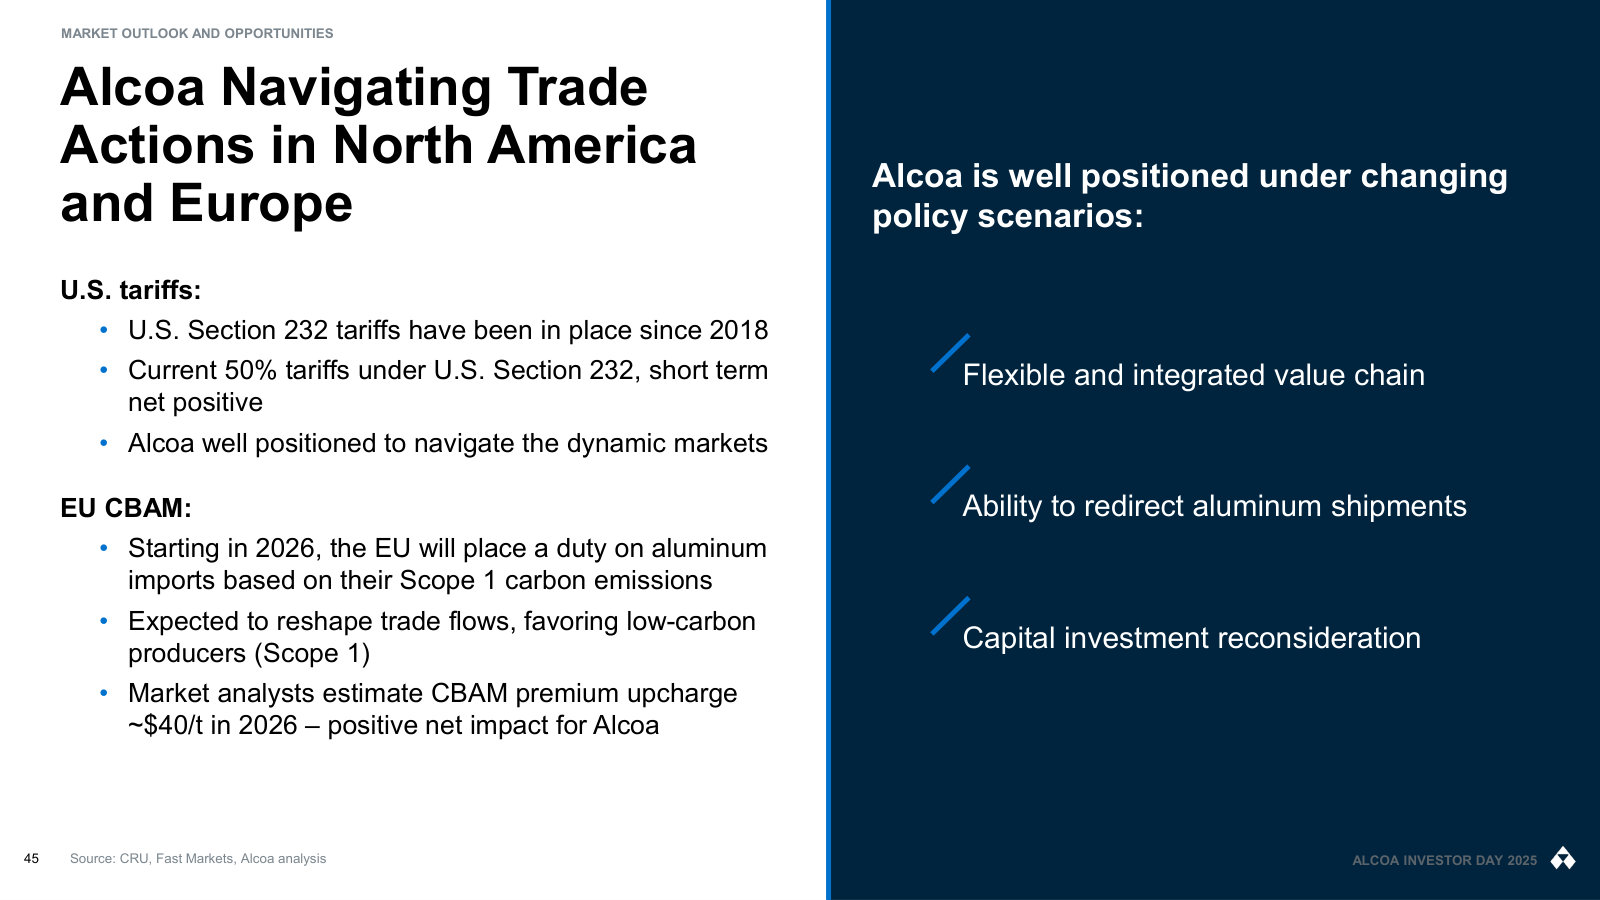
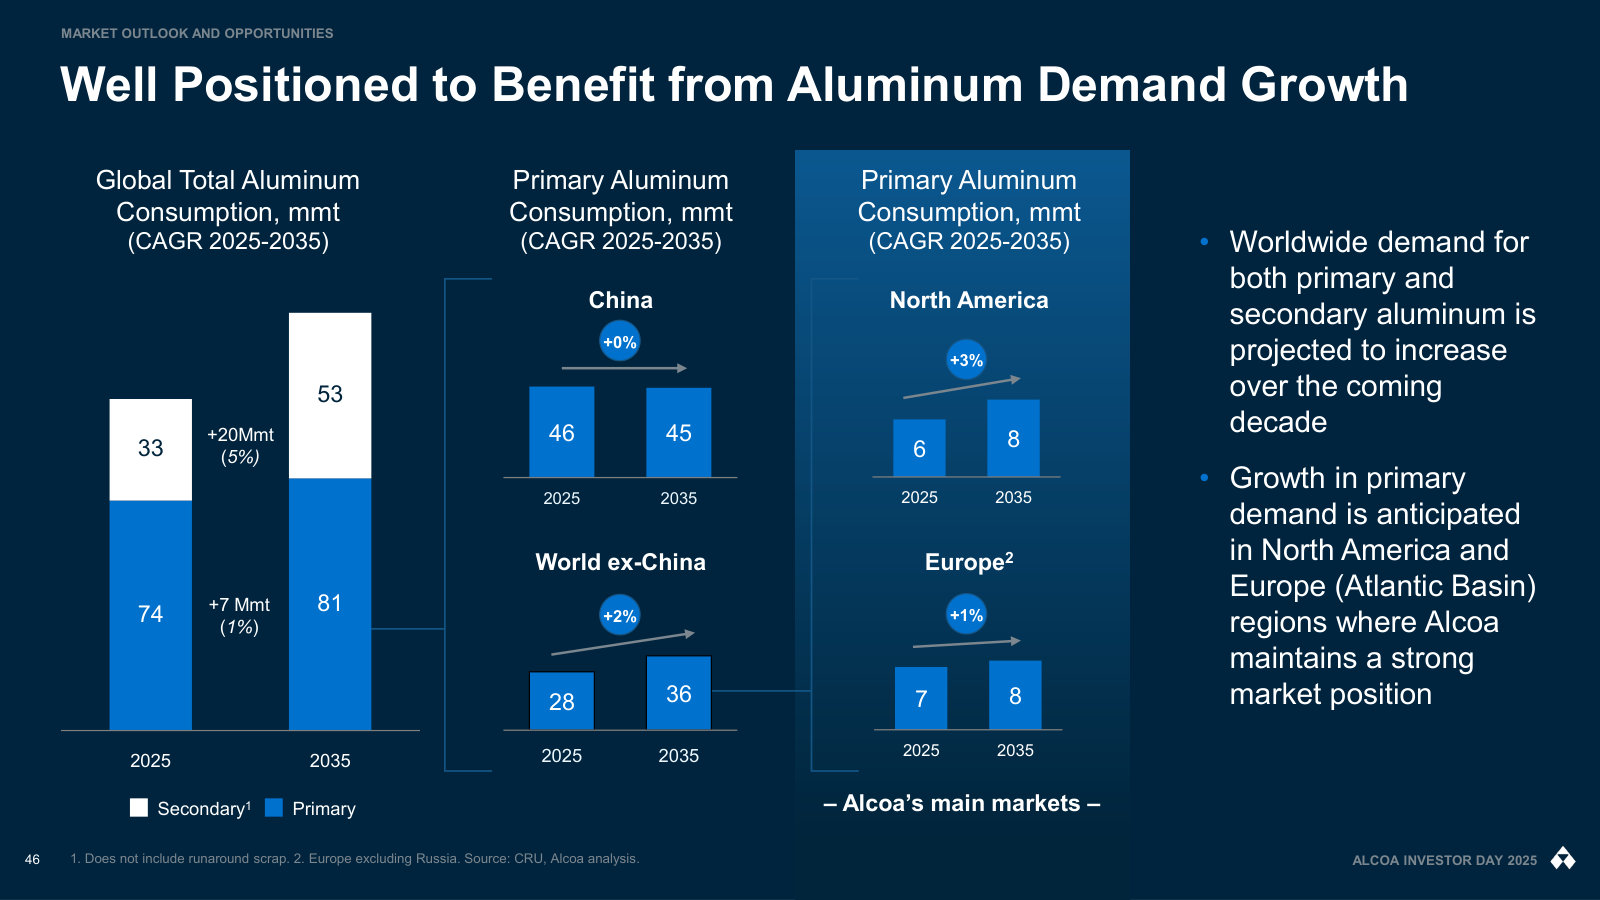
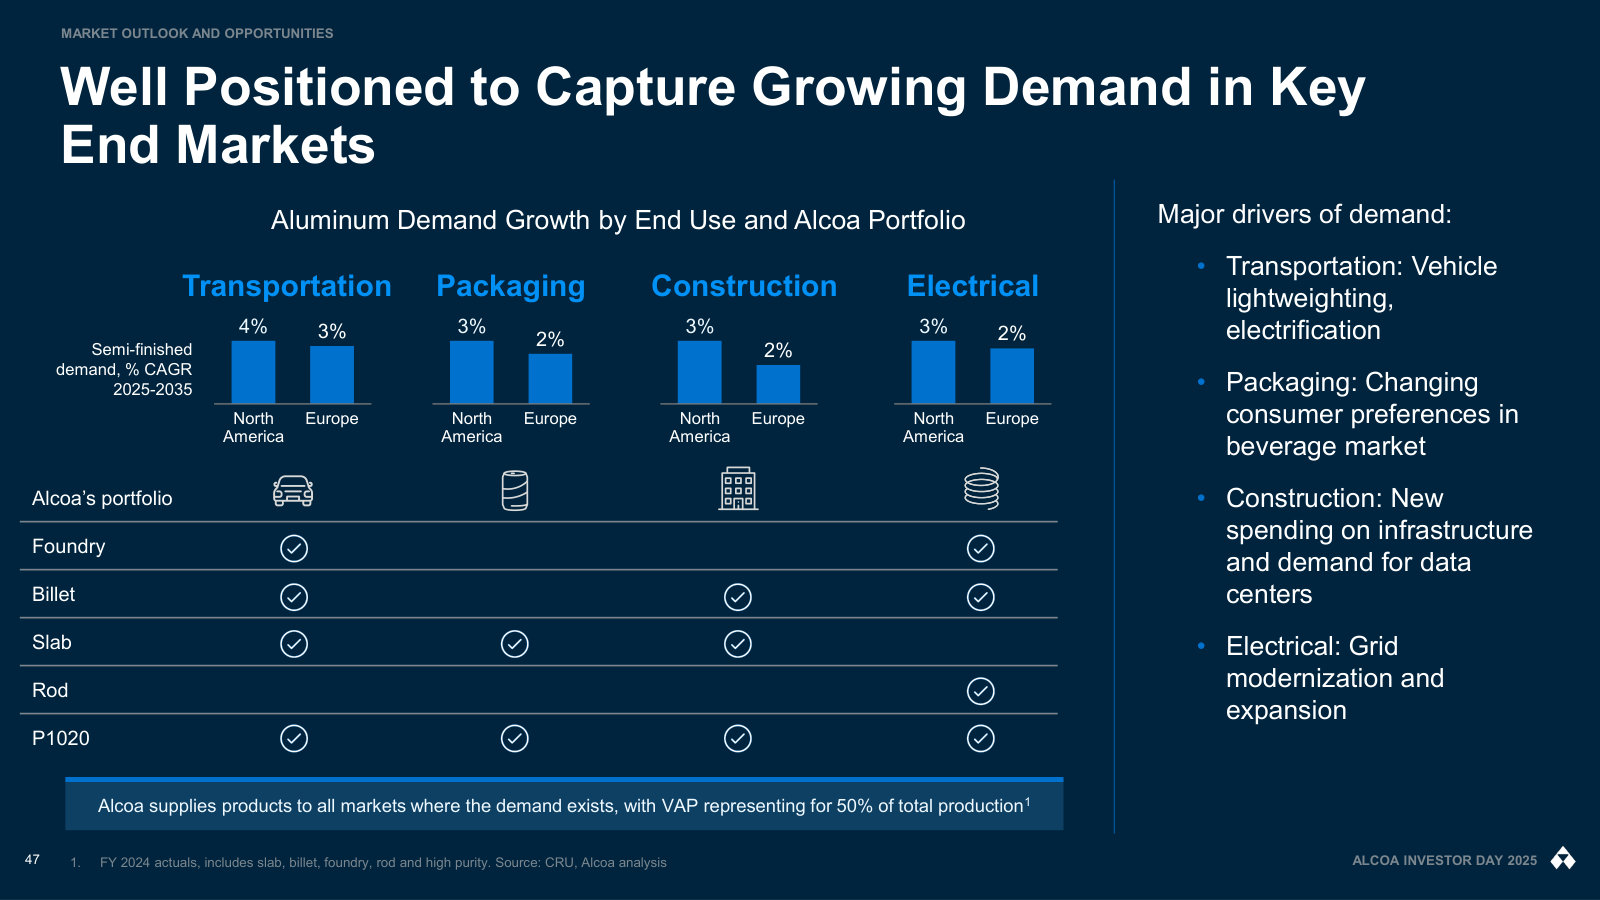
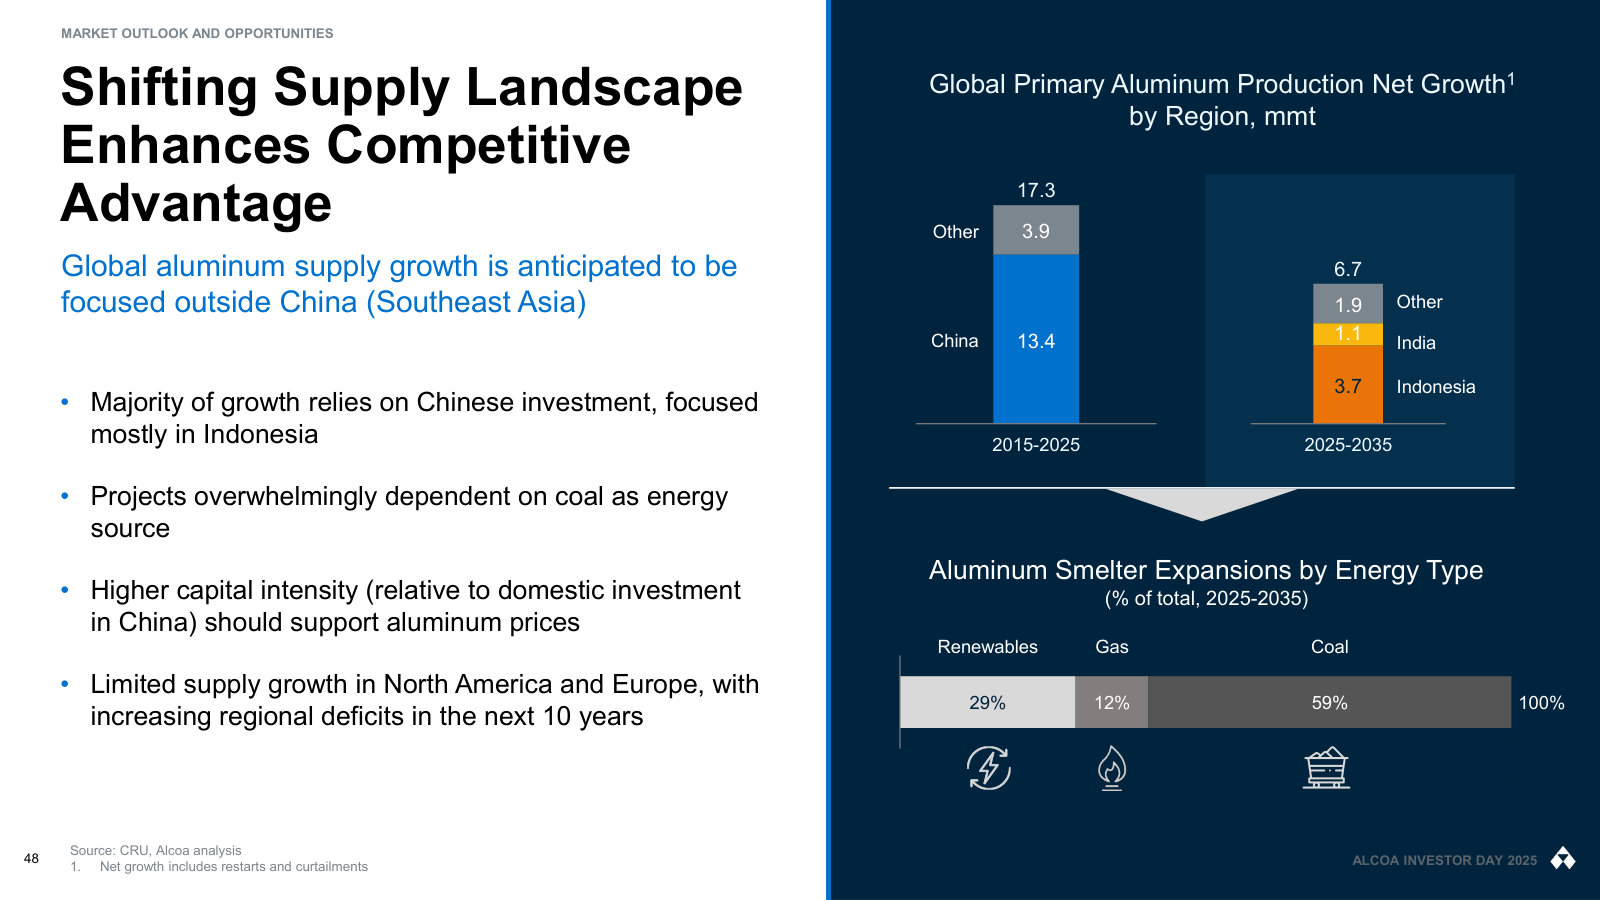
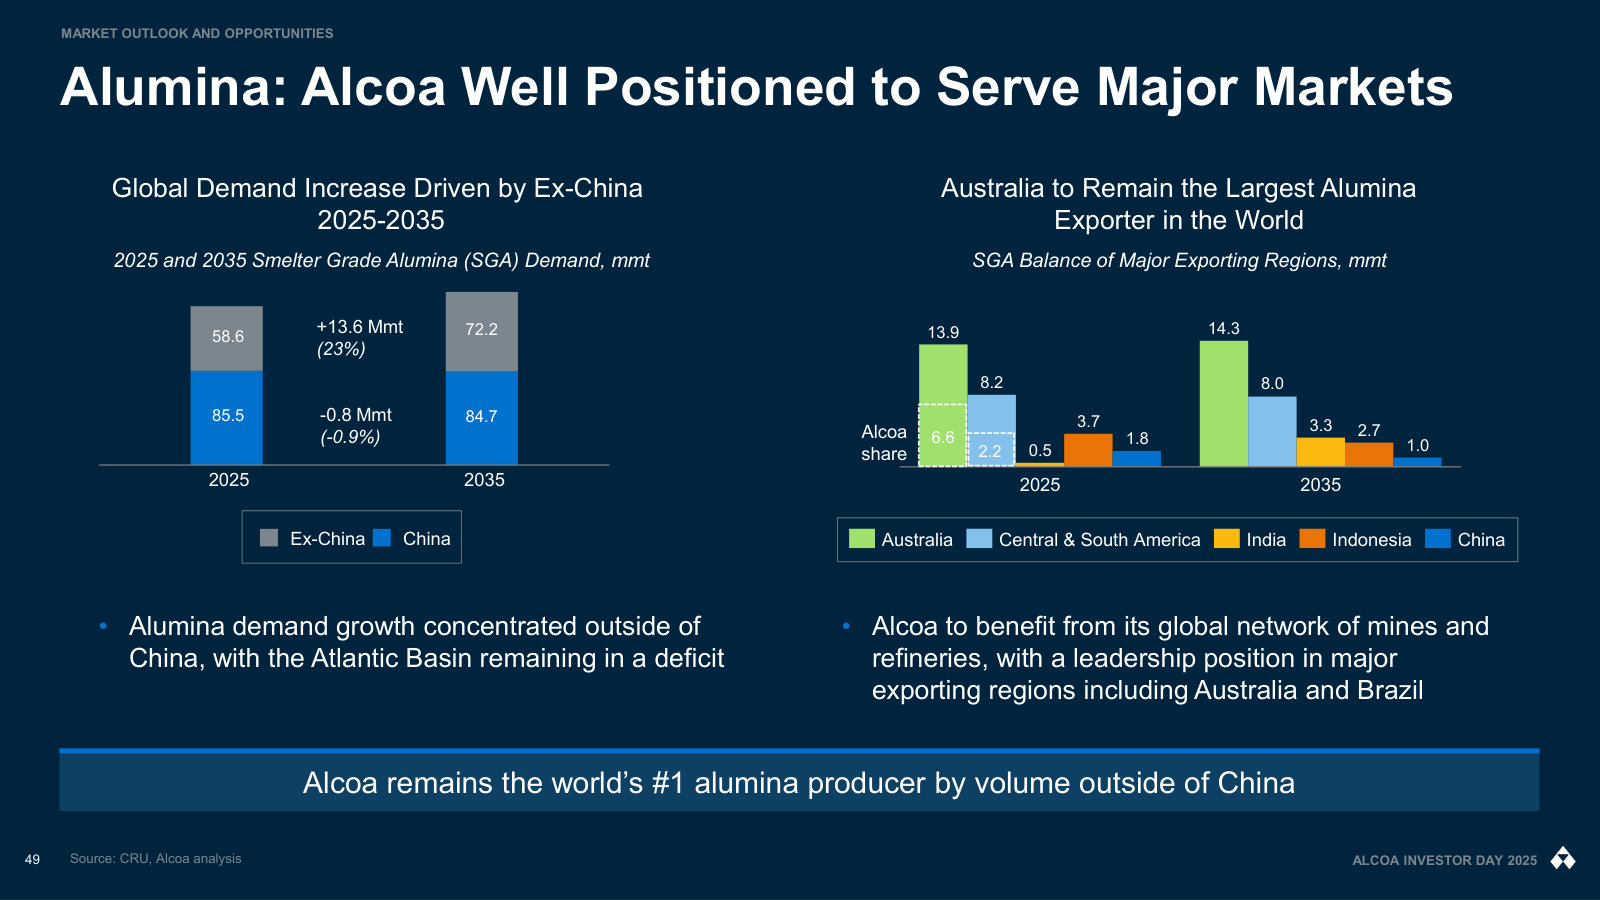
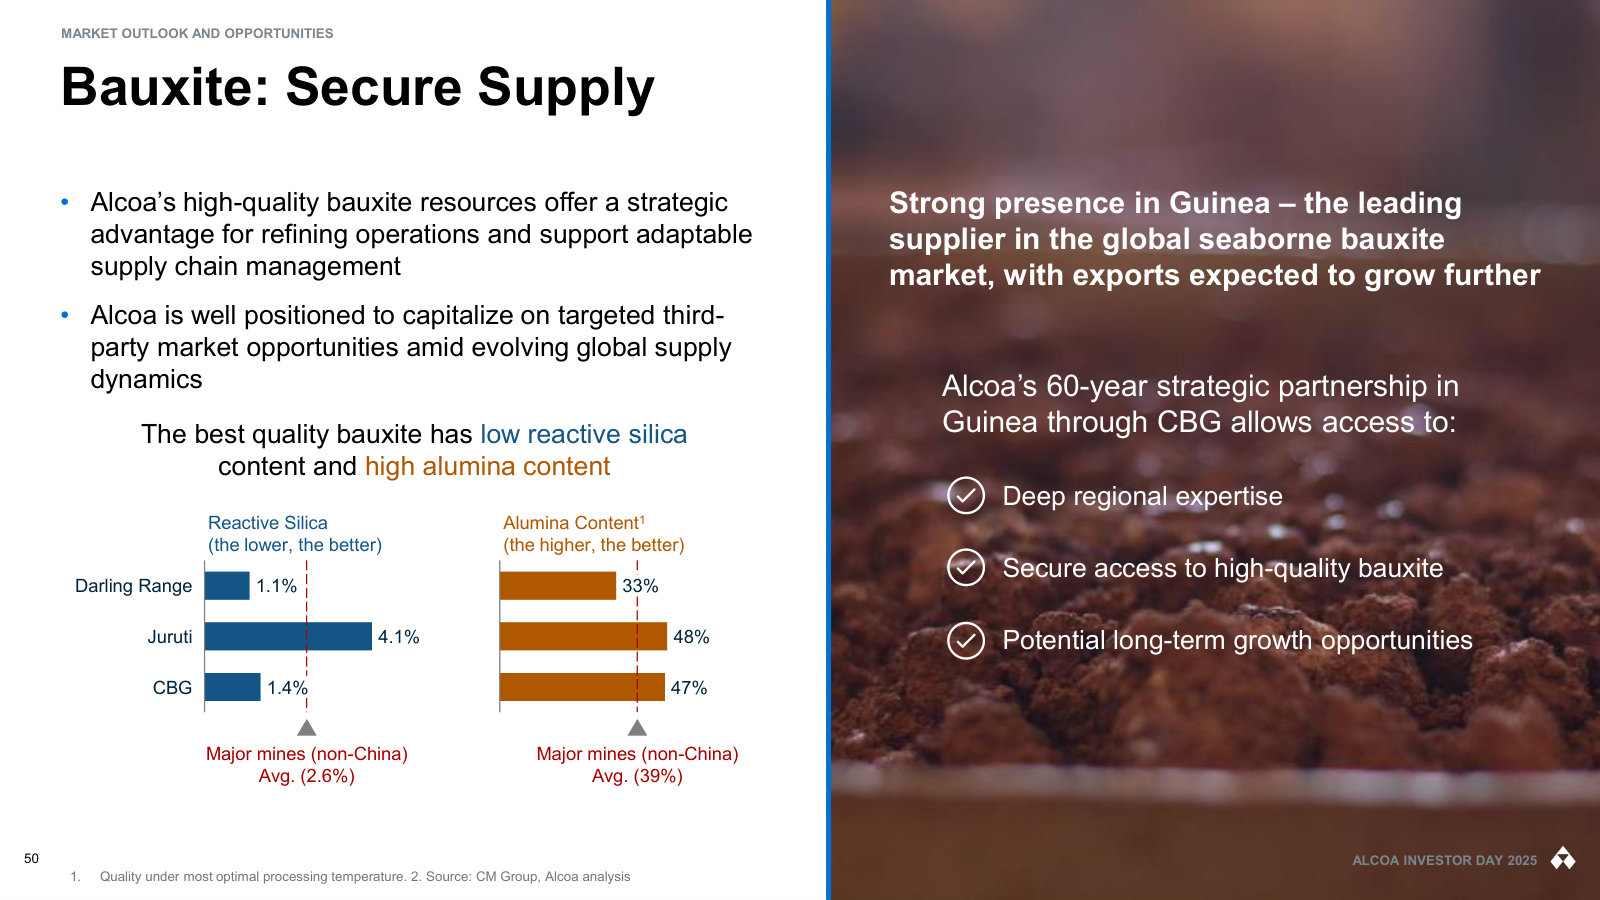
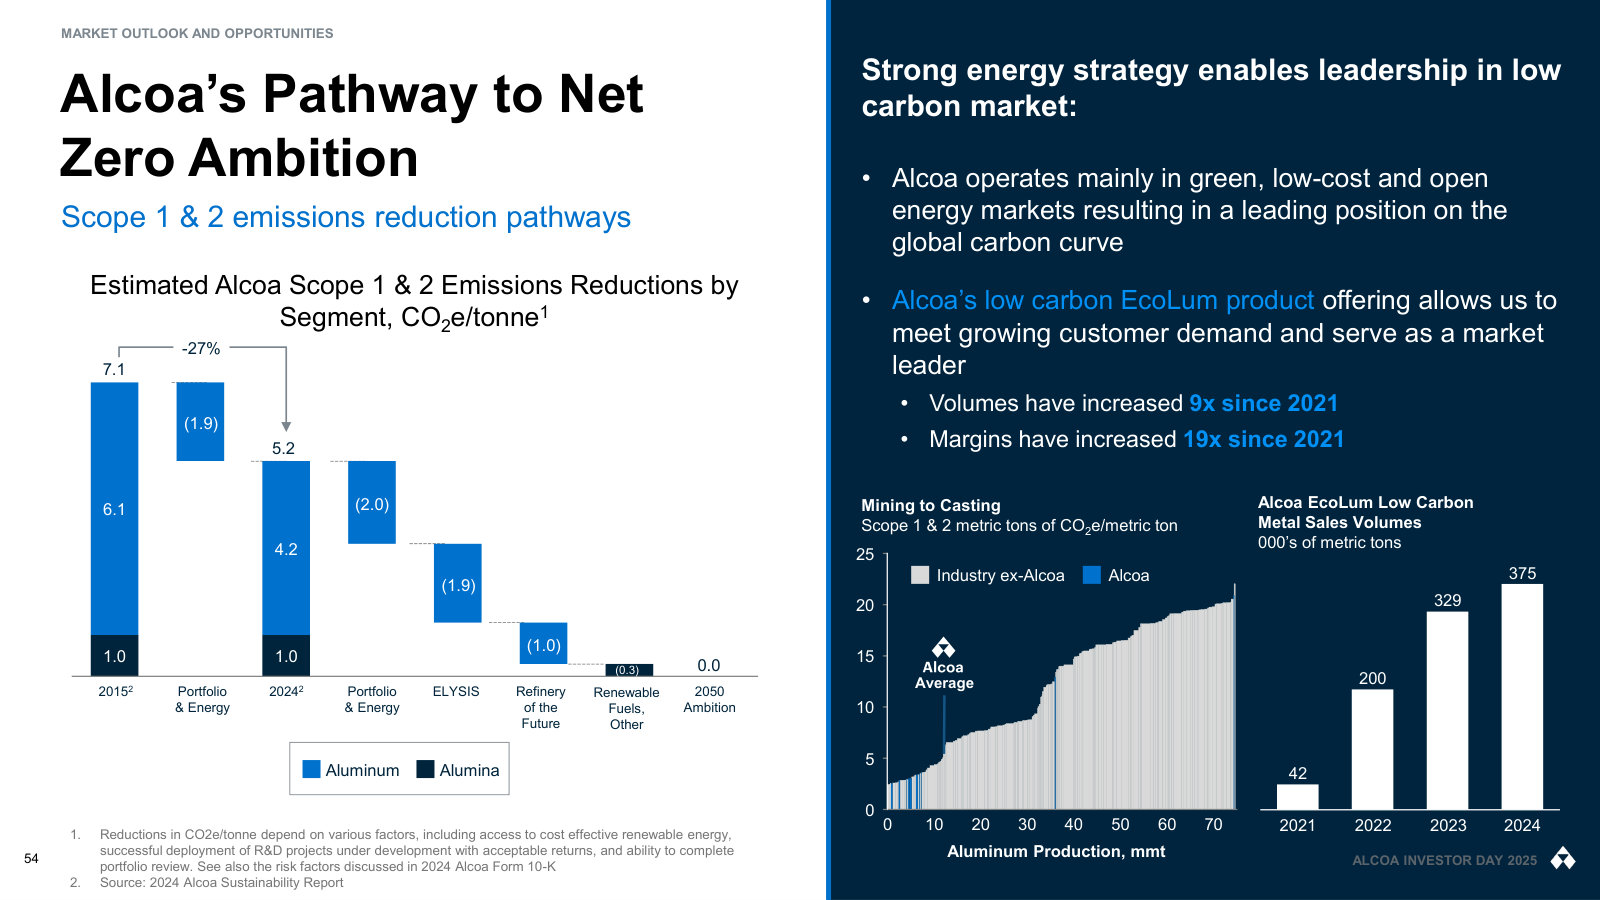
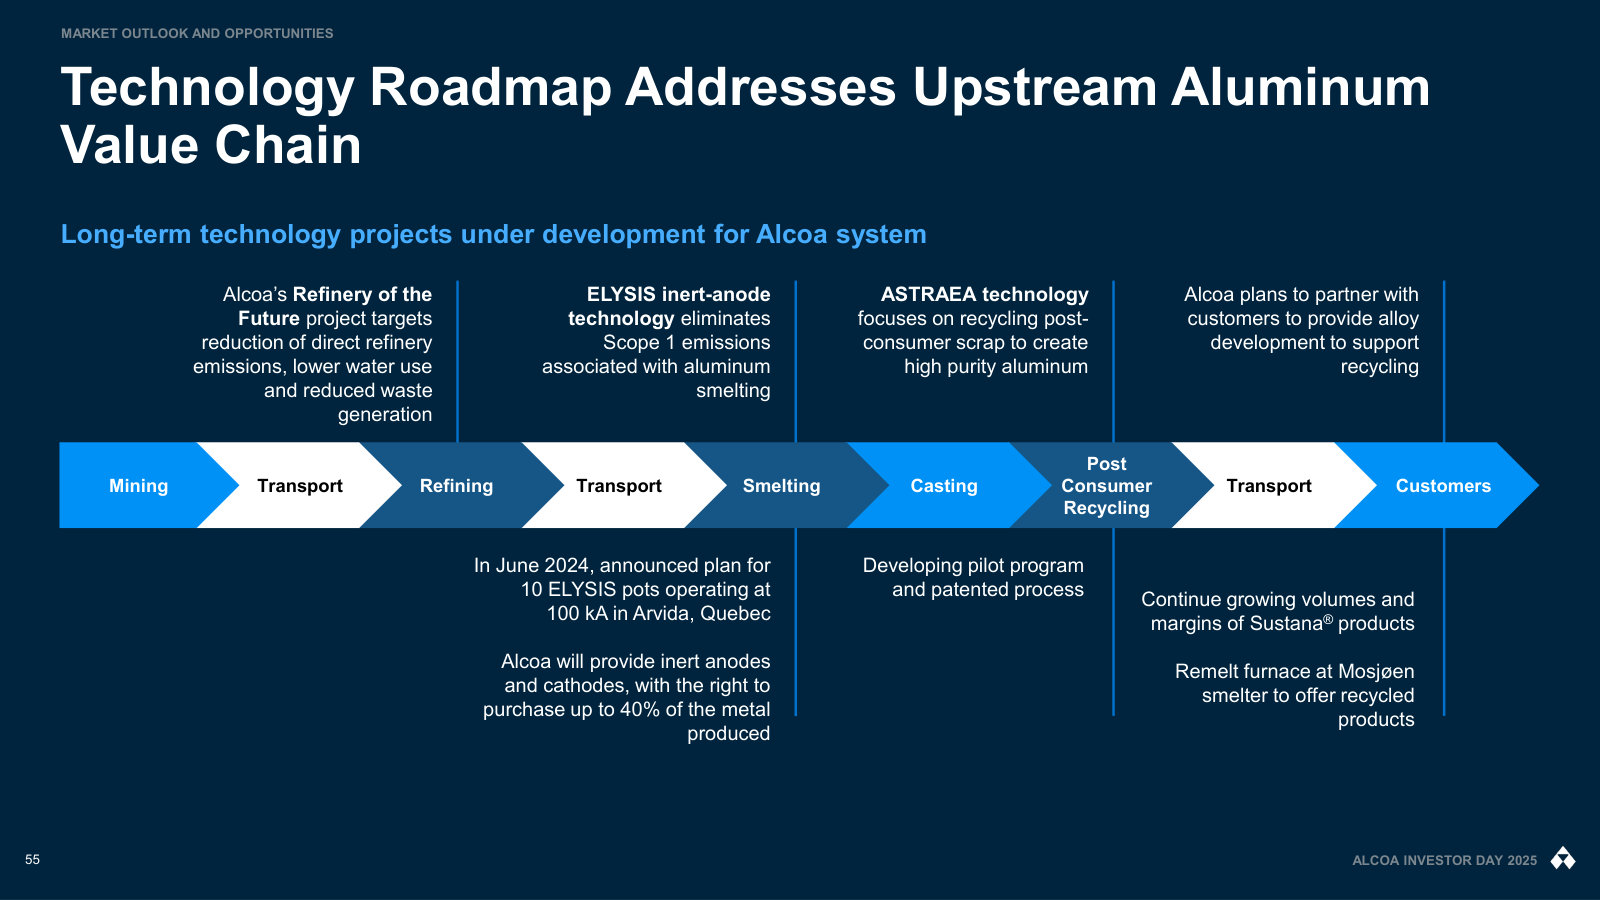
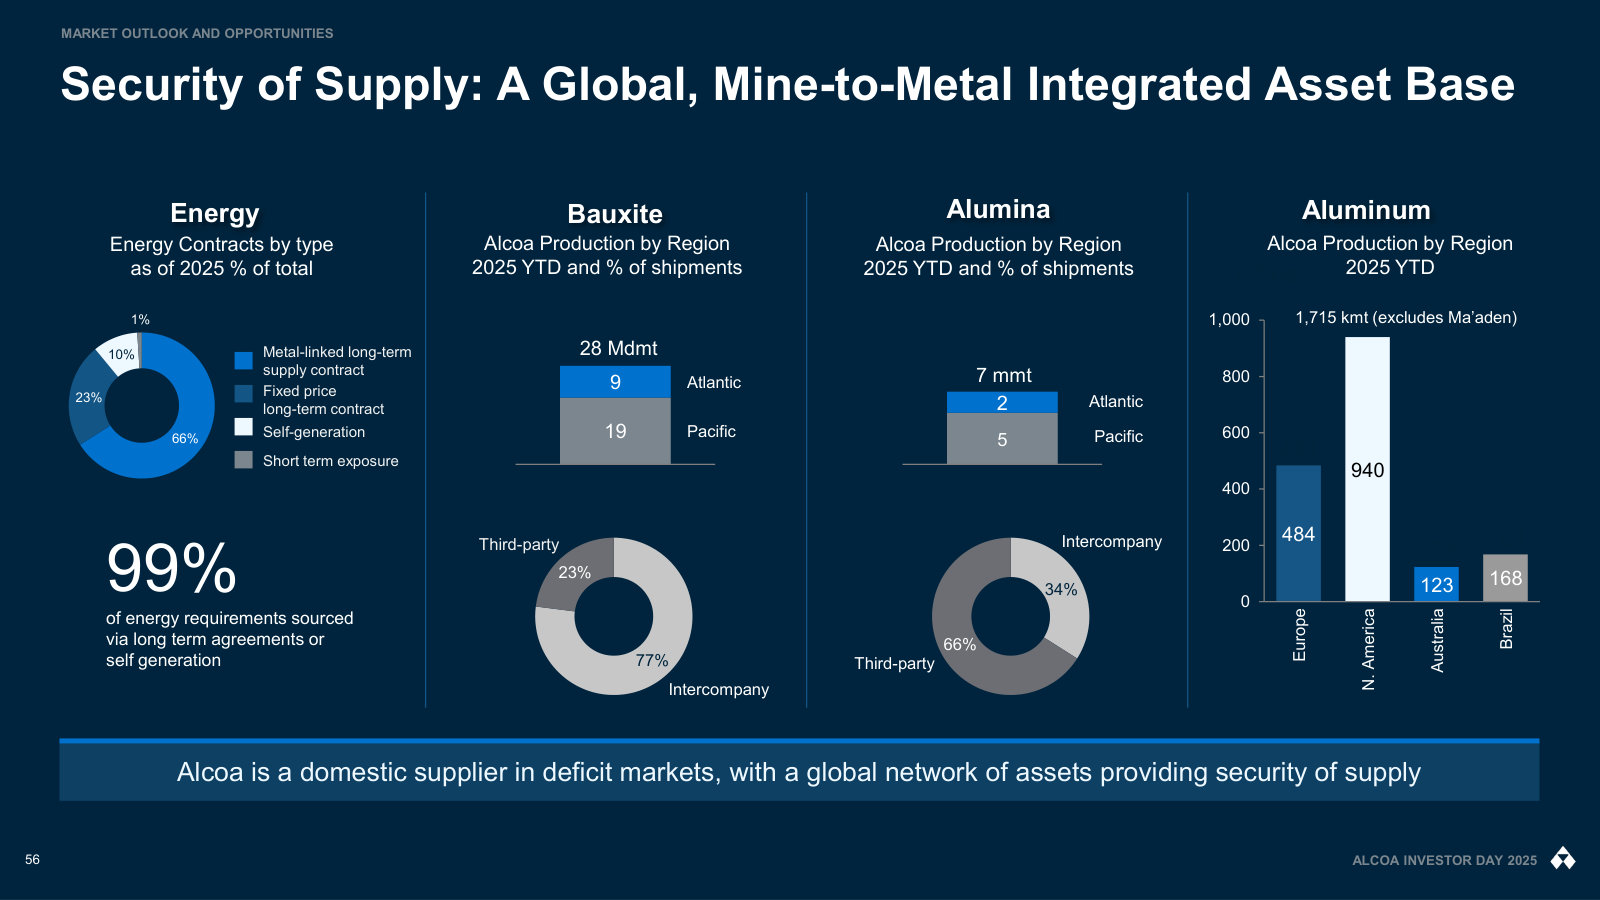
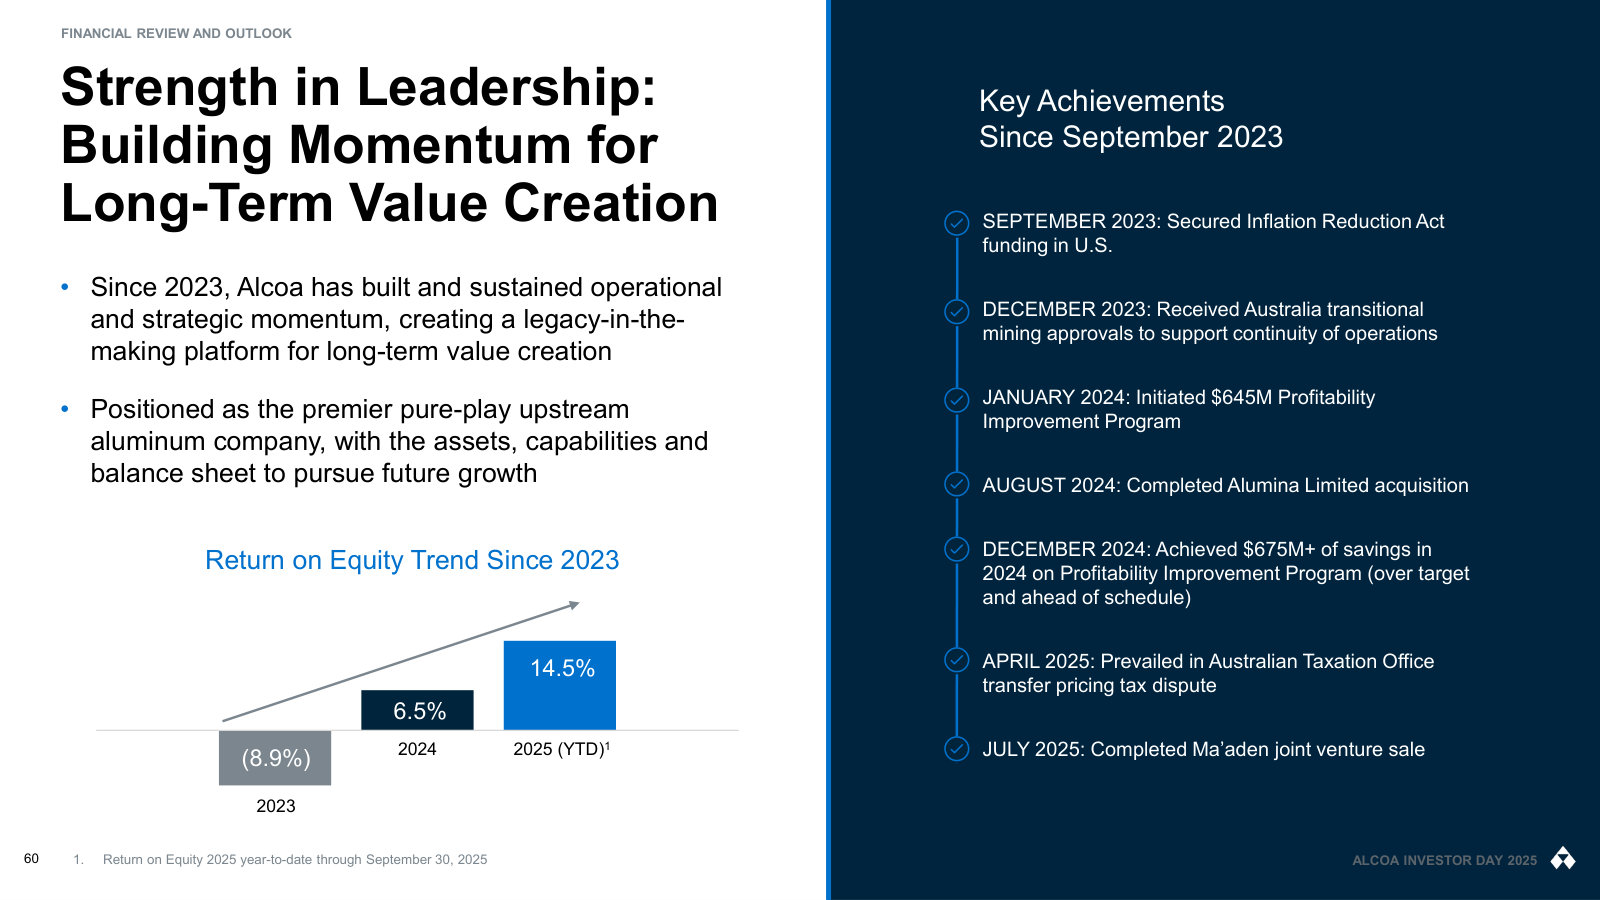
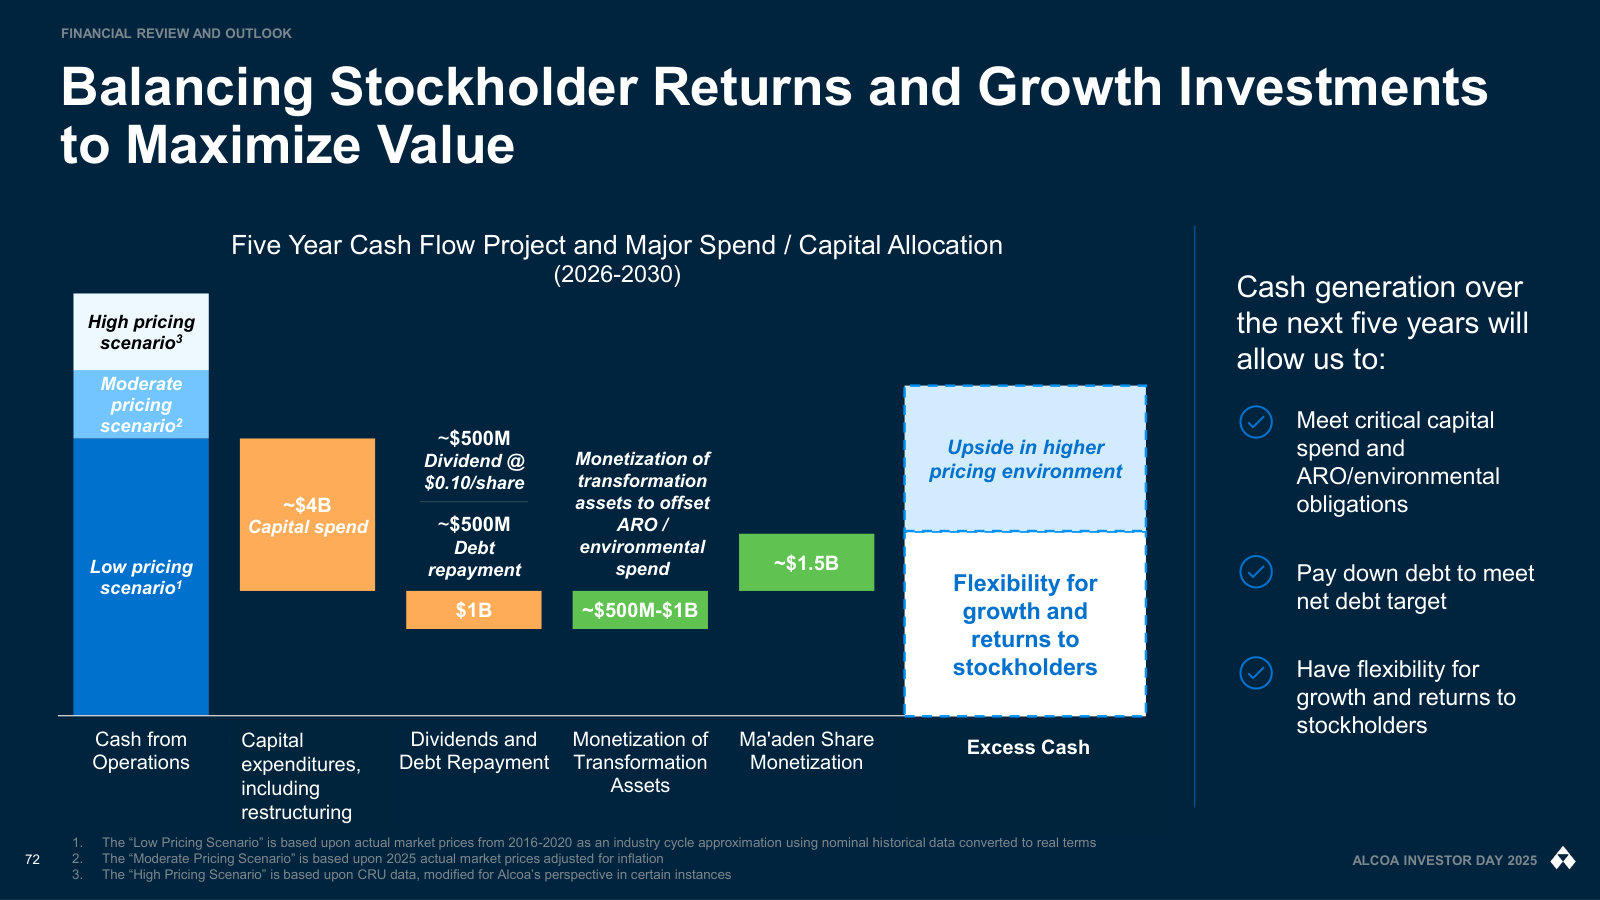
Management's fullest account of the business: assets by region, cost position, market structure and the five-year capital plan. · Open the full document →
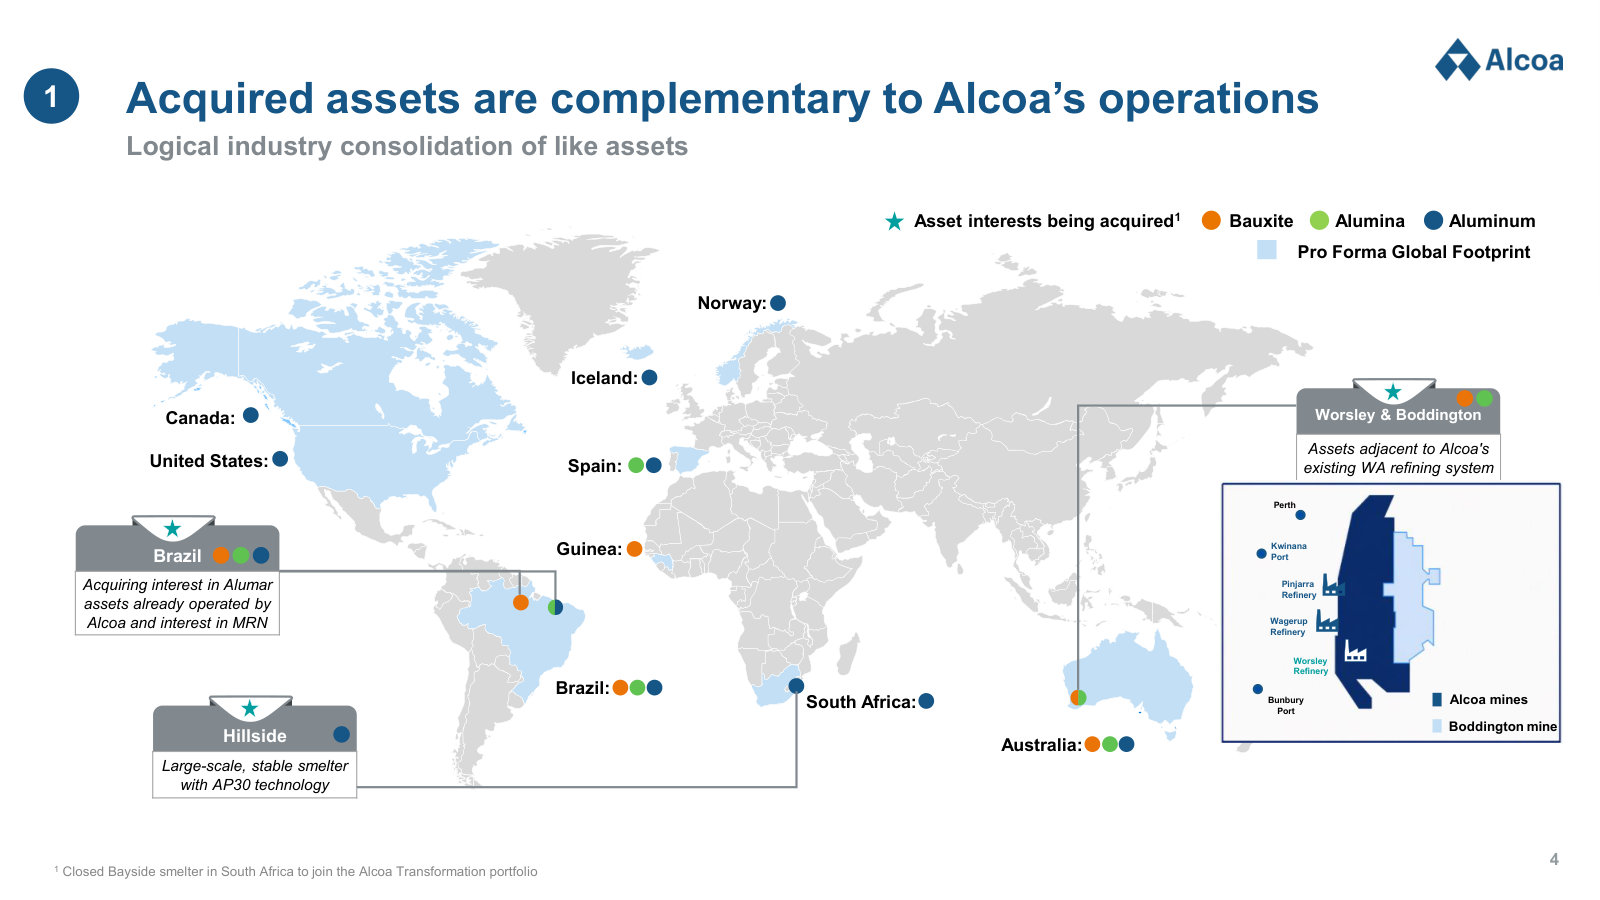
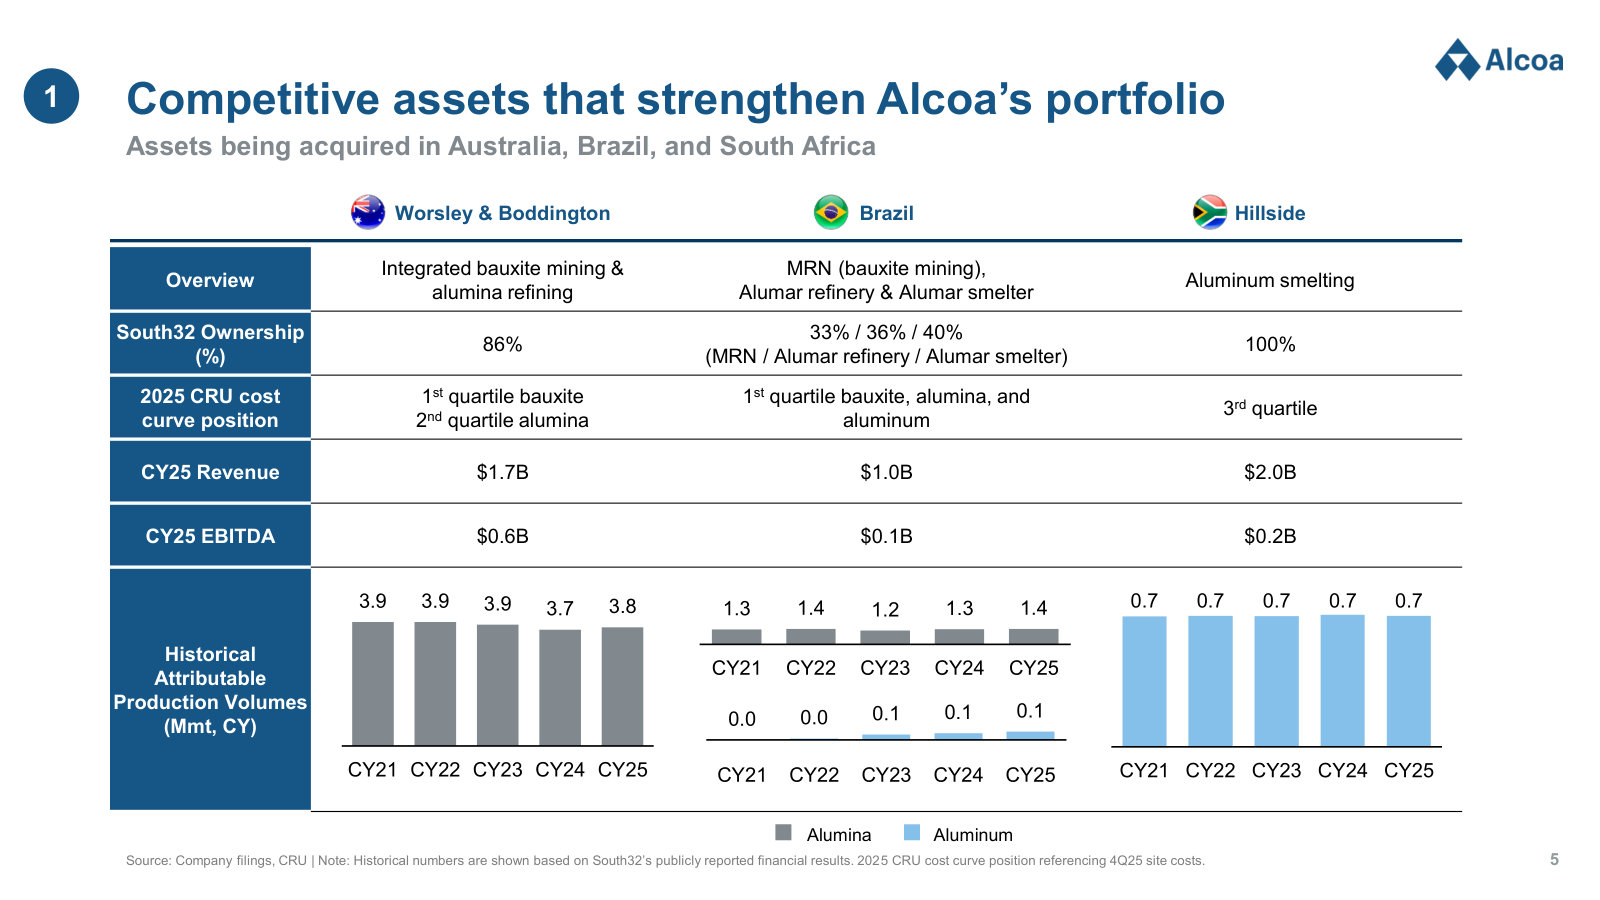
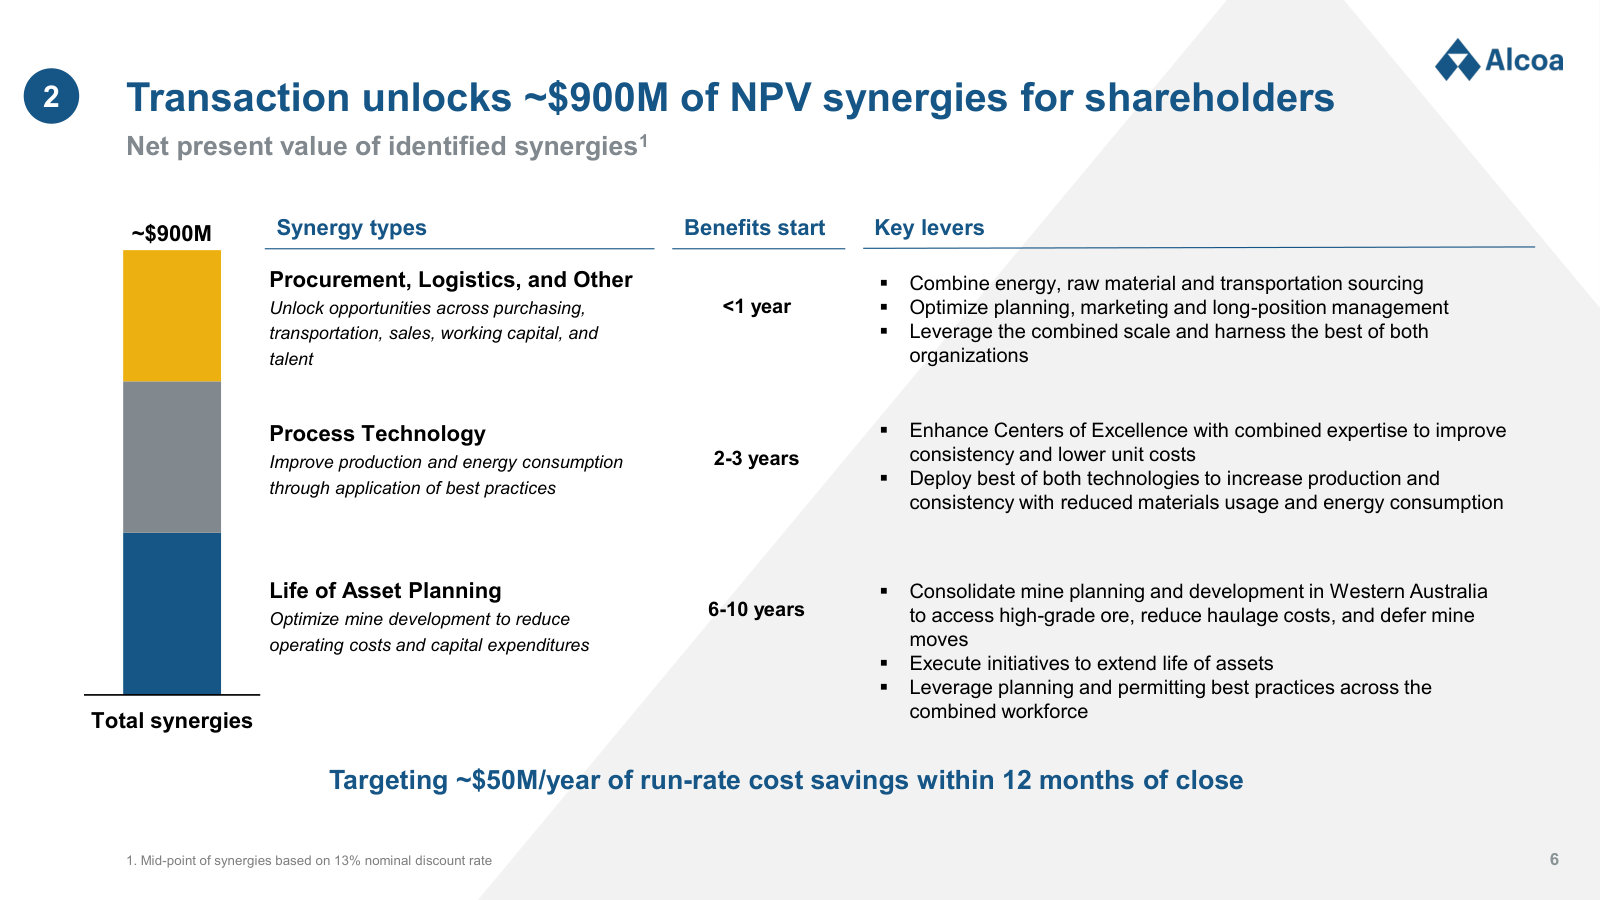
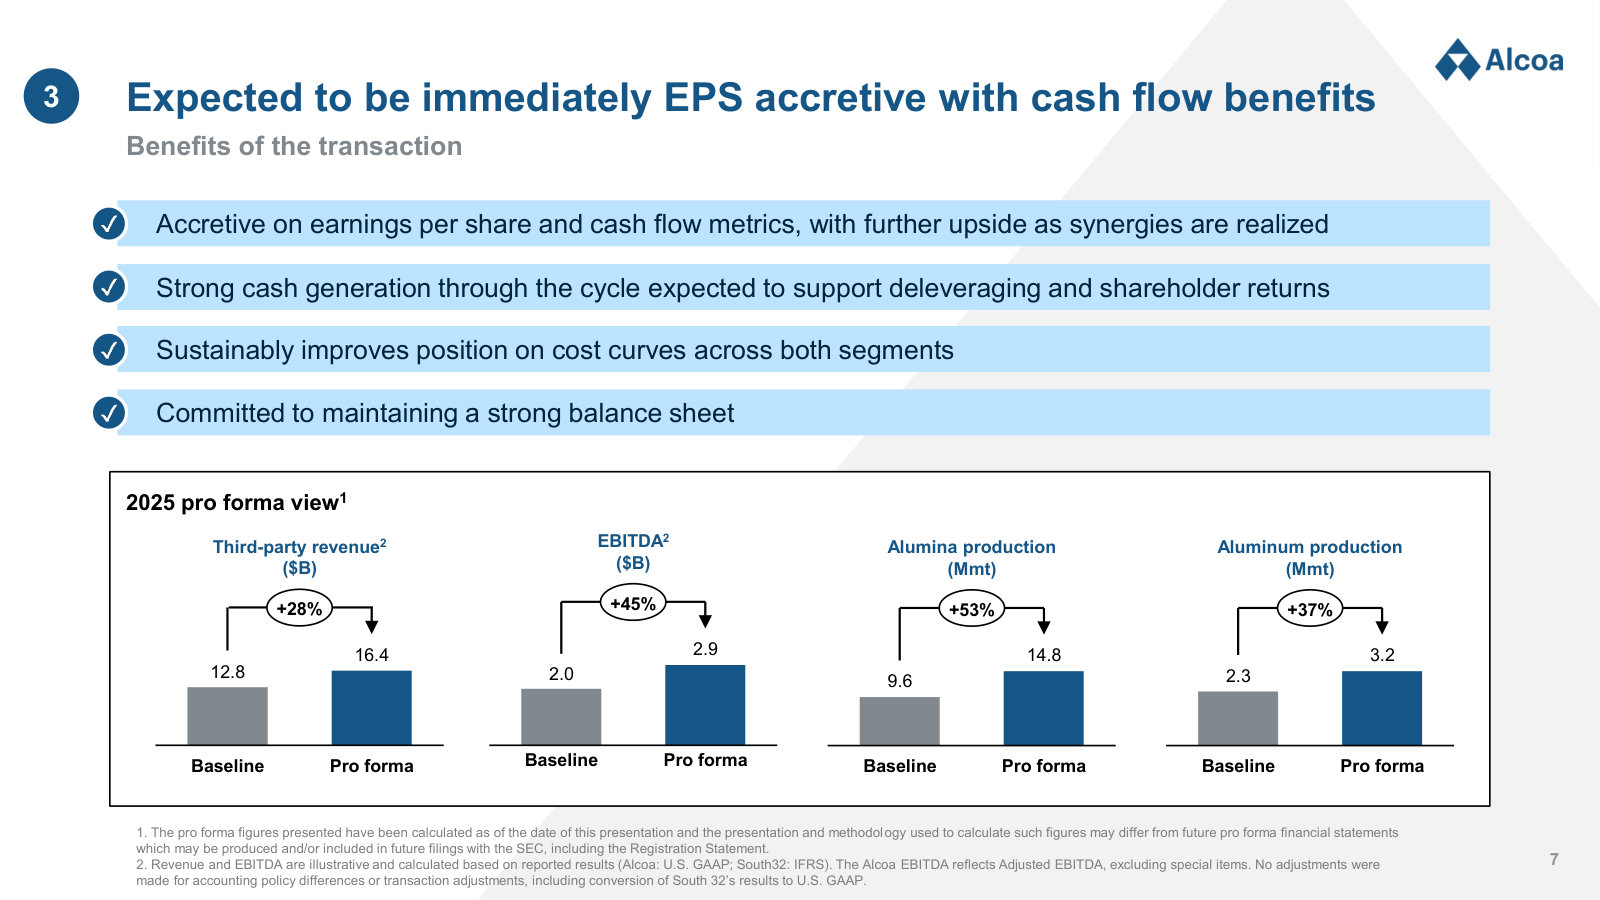
Strategic Acquisition of South32's Bauxite, Alumina and Aluminum Assets — Jun 2026
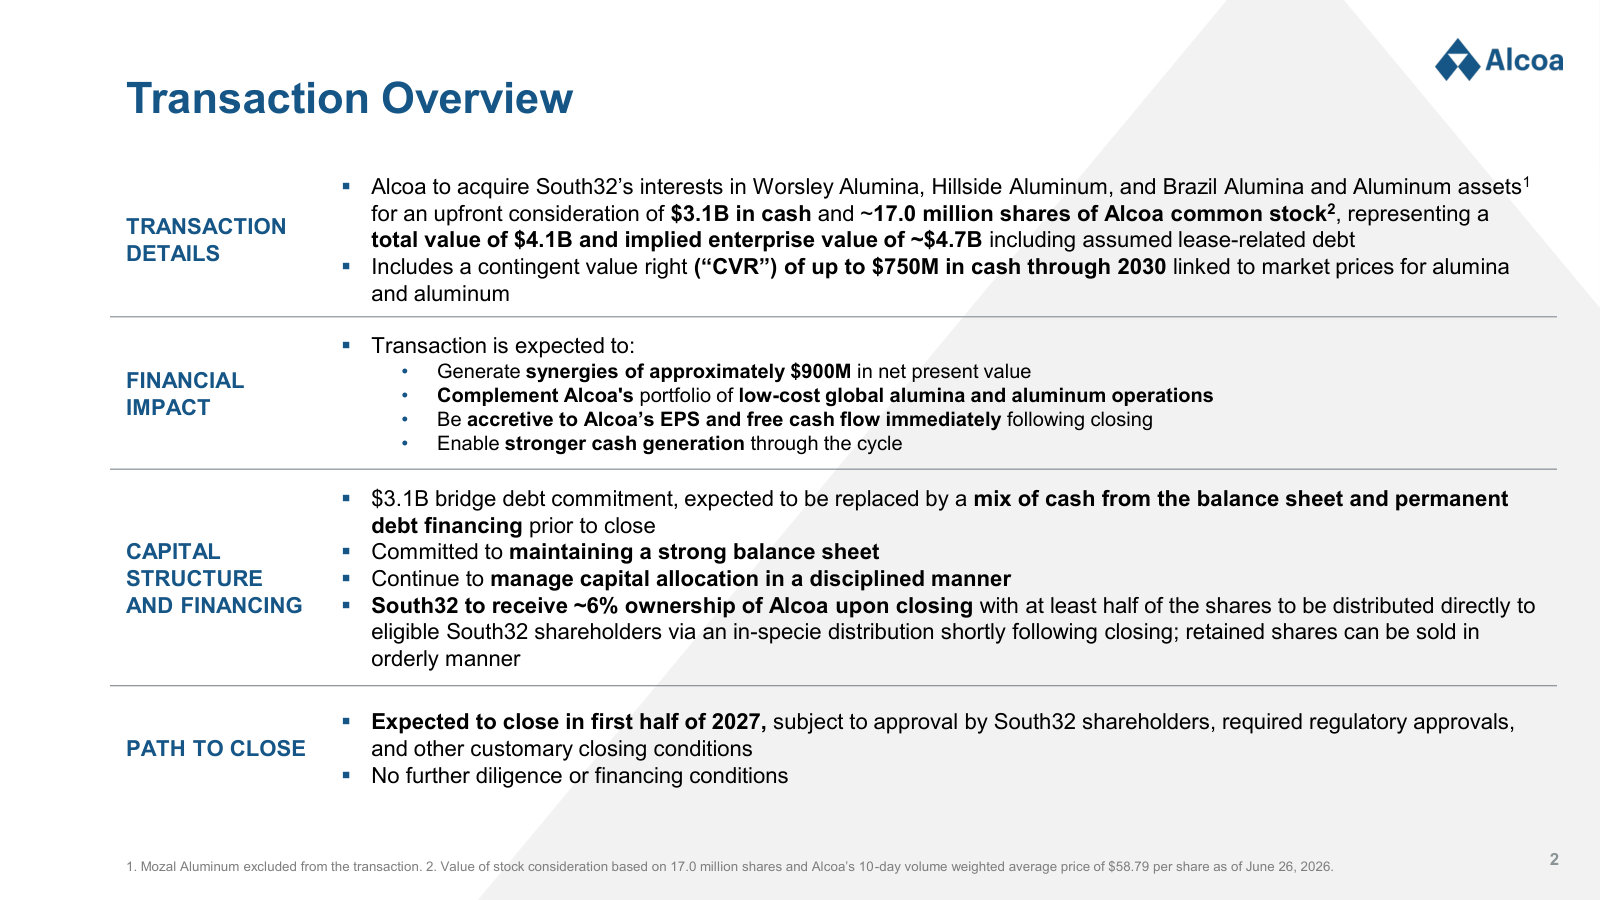
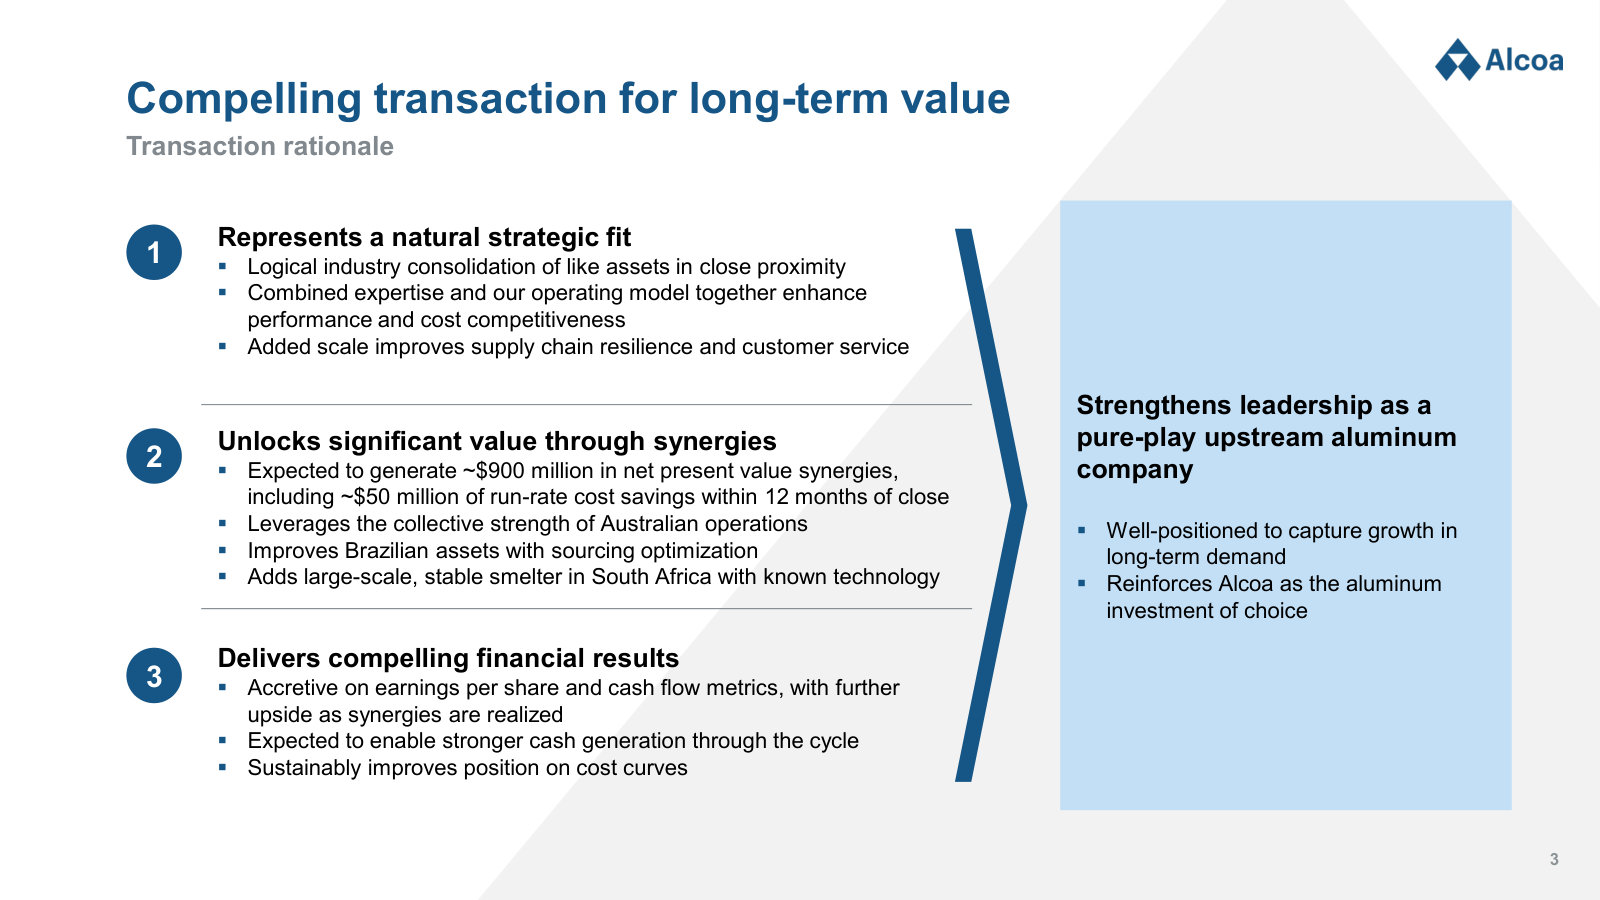
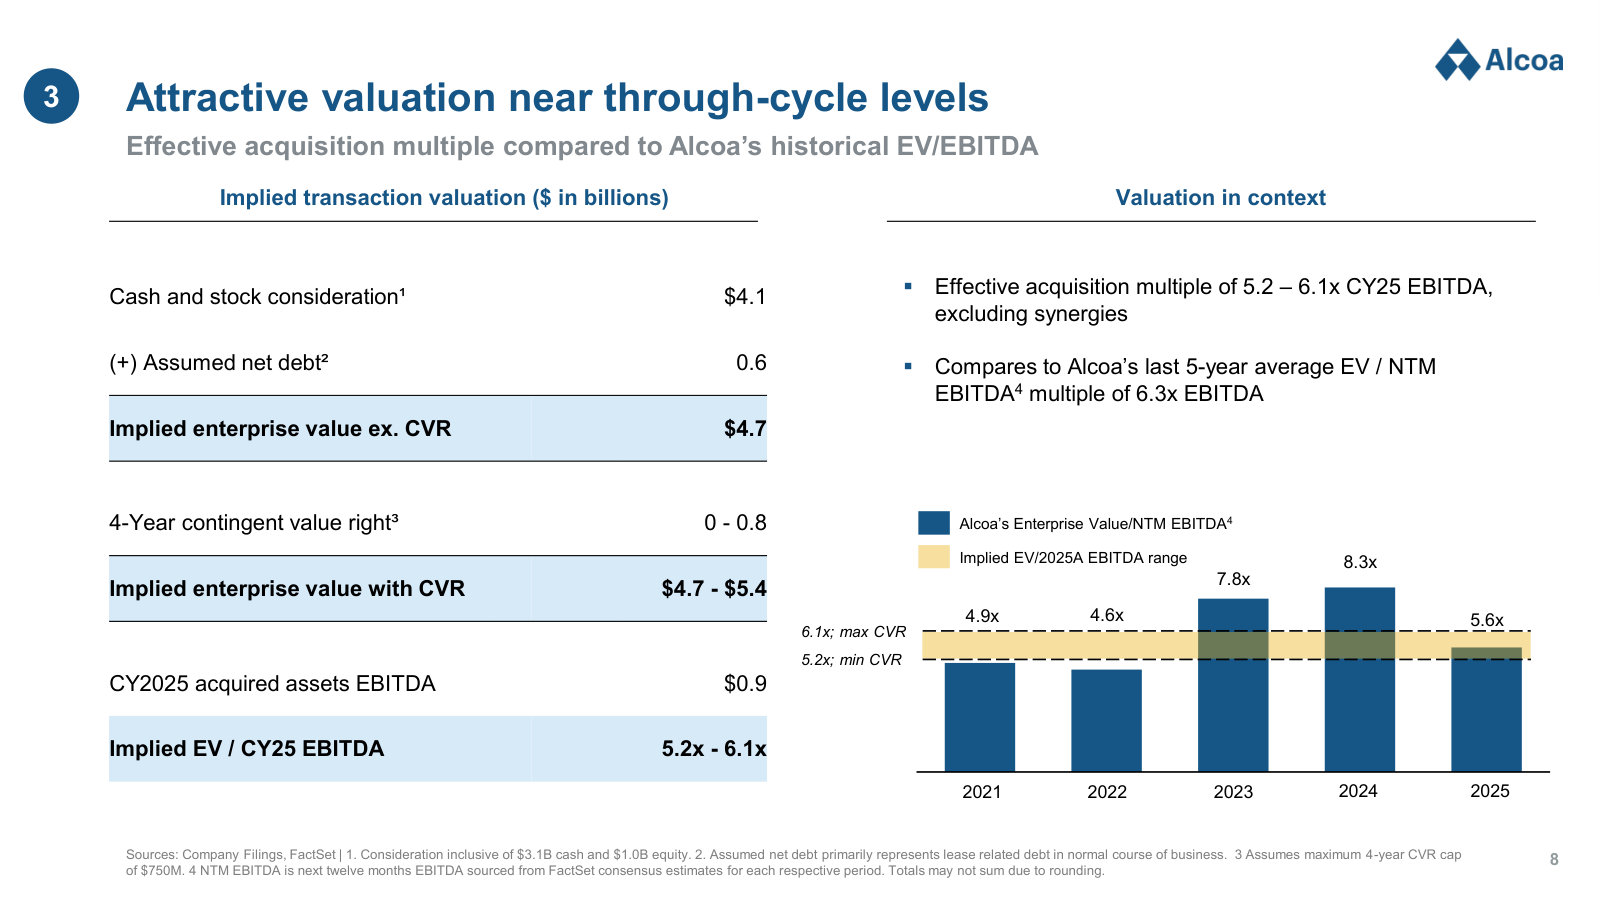
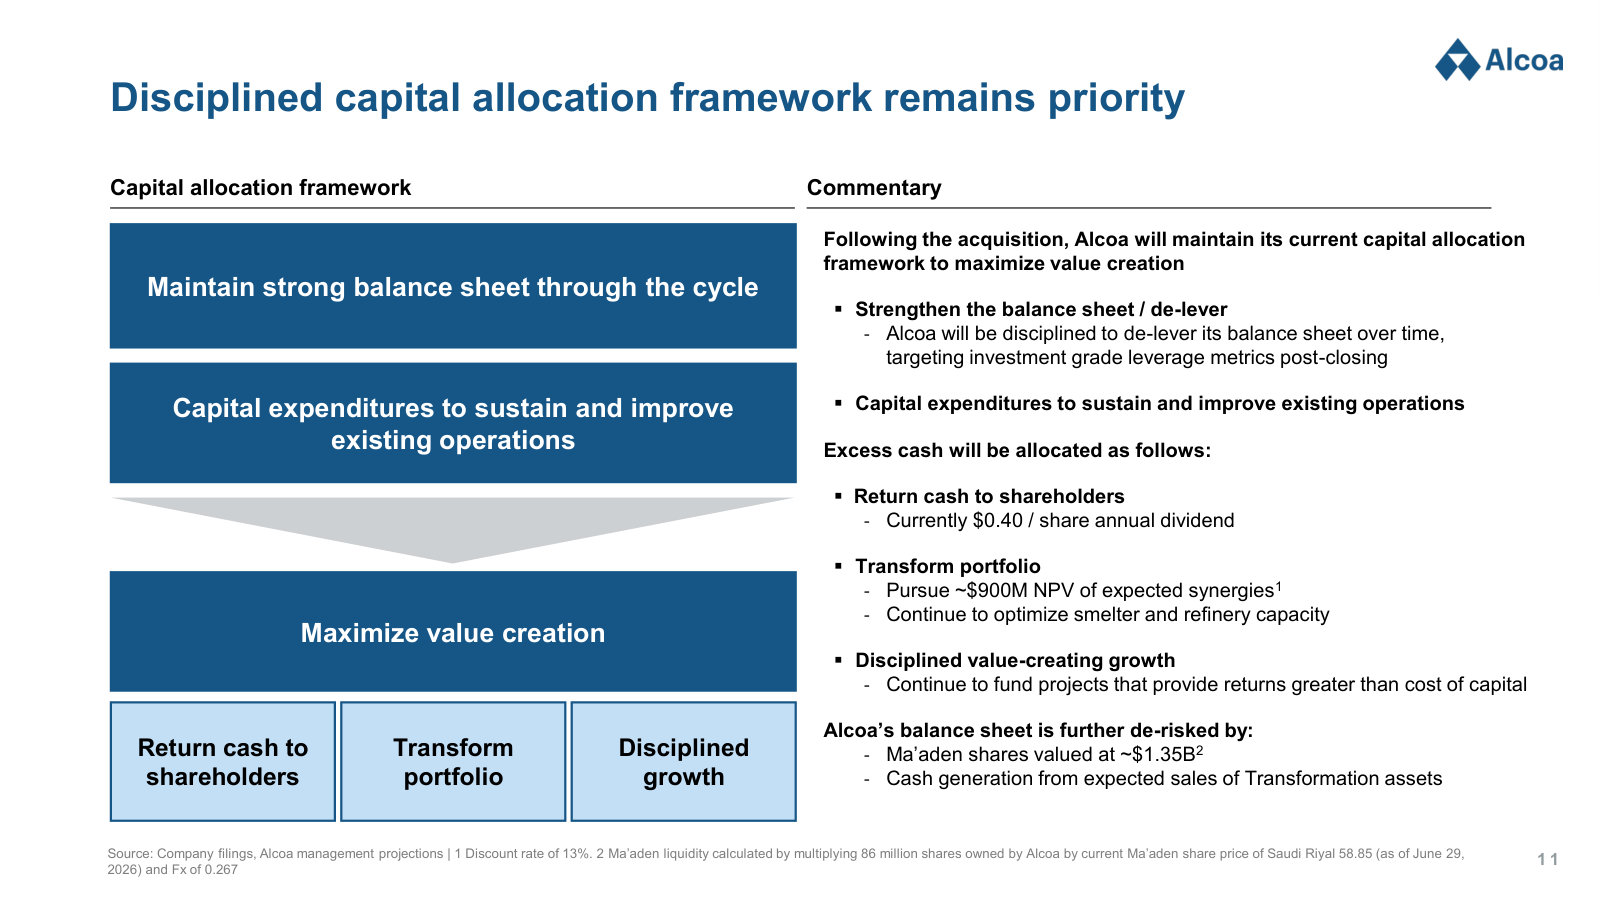
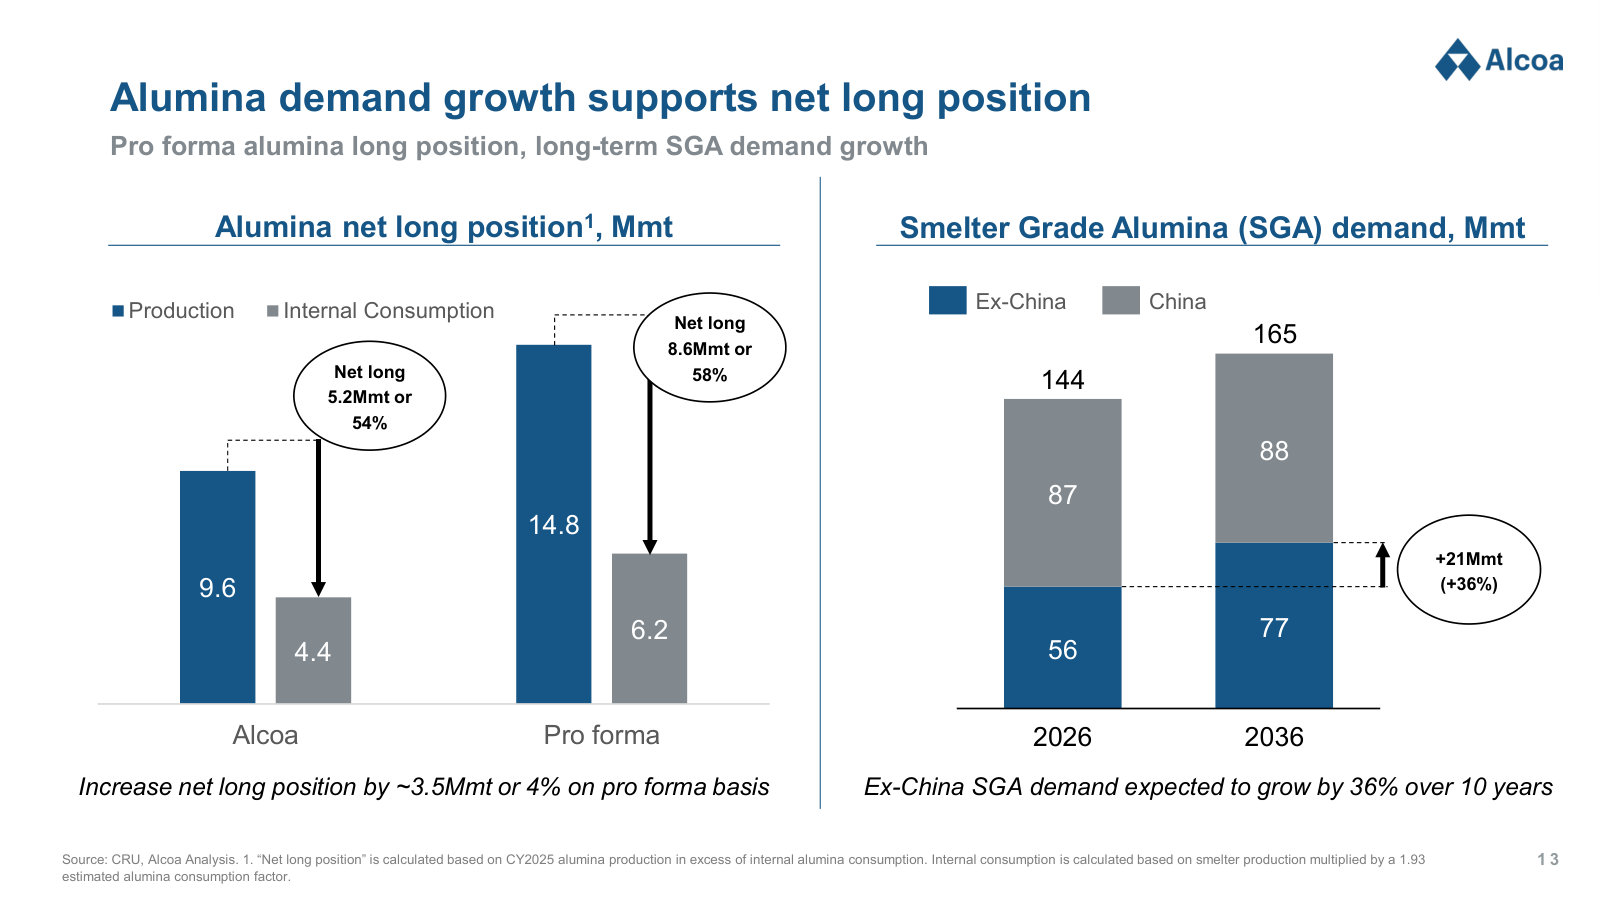
The transaction that reshapes the portfolio, with the assets, synergies, valuation and pro forma scale laid out. · Open the full document →
Second Quarter 2026 Earnings Presentation — 2Q26
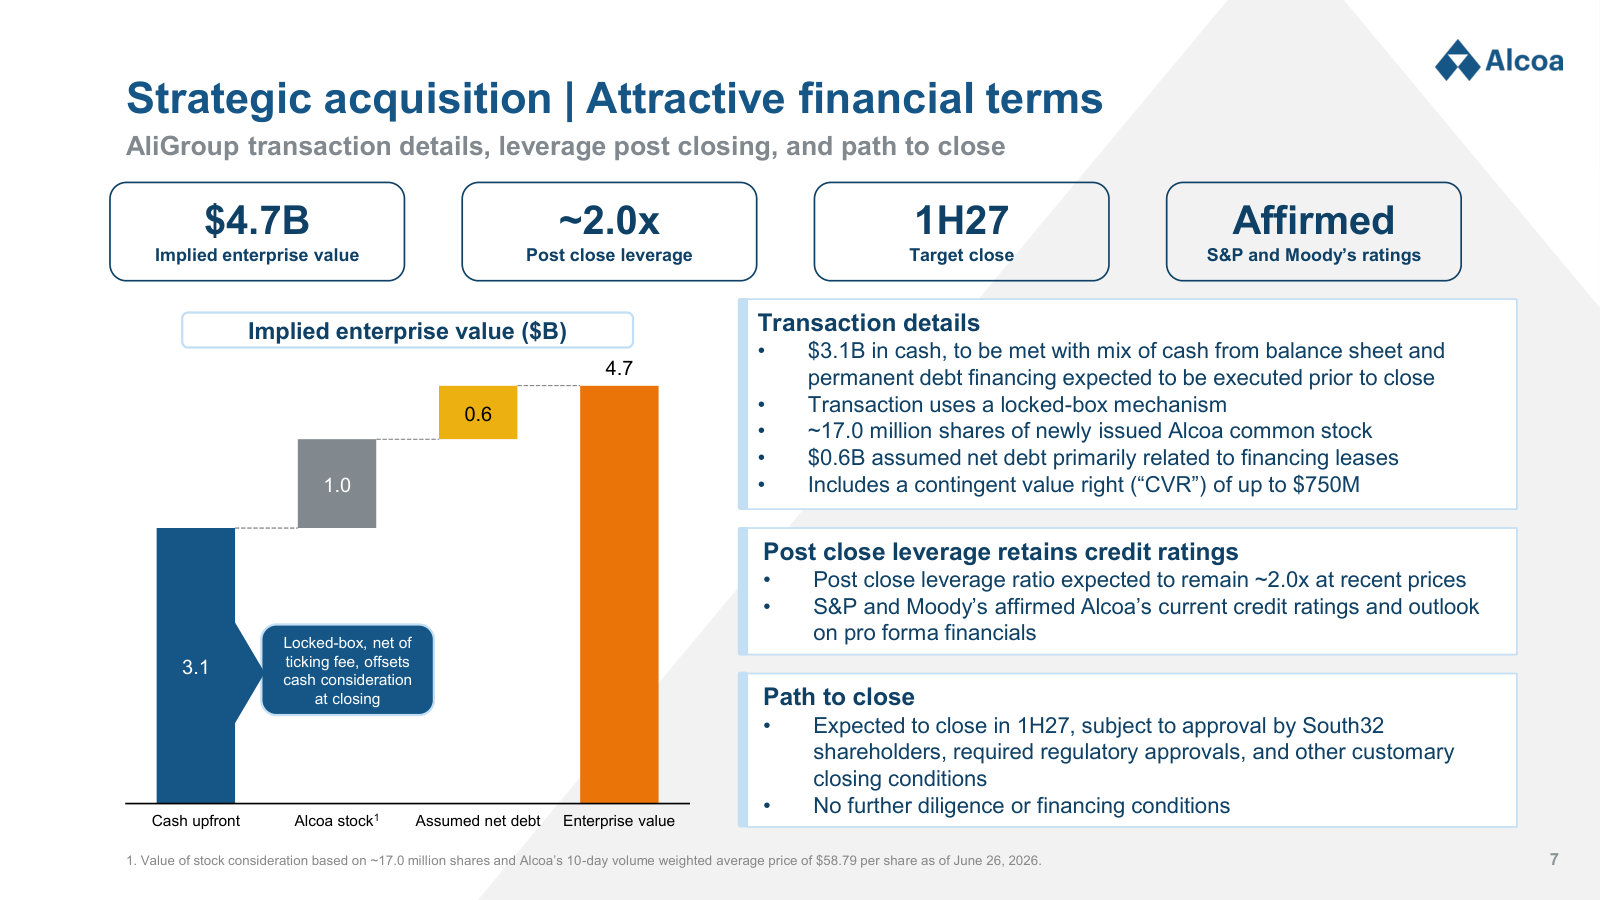
Where the company stands now: latest results, FY26 guidance, market conditions, and an appendix that explains unit economics. · Open the full document →
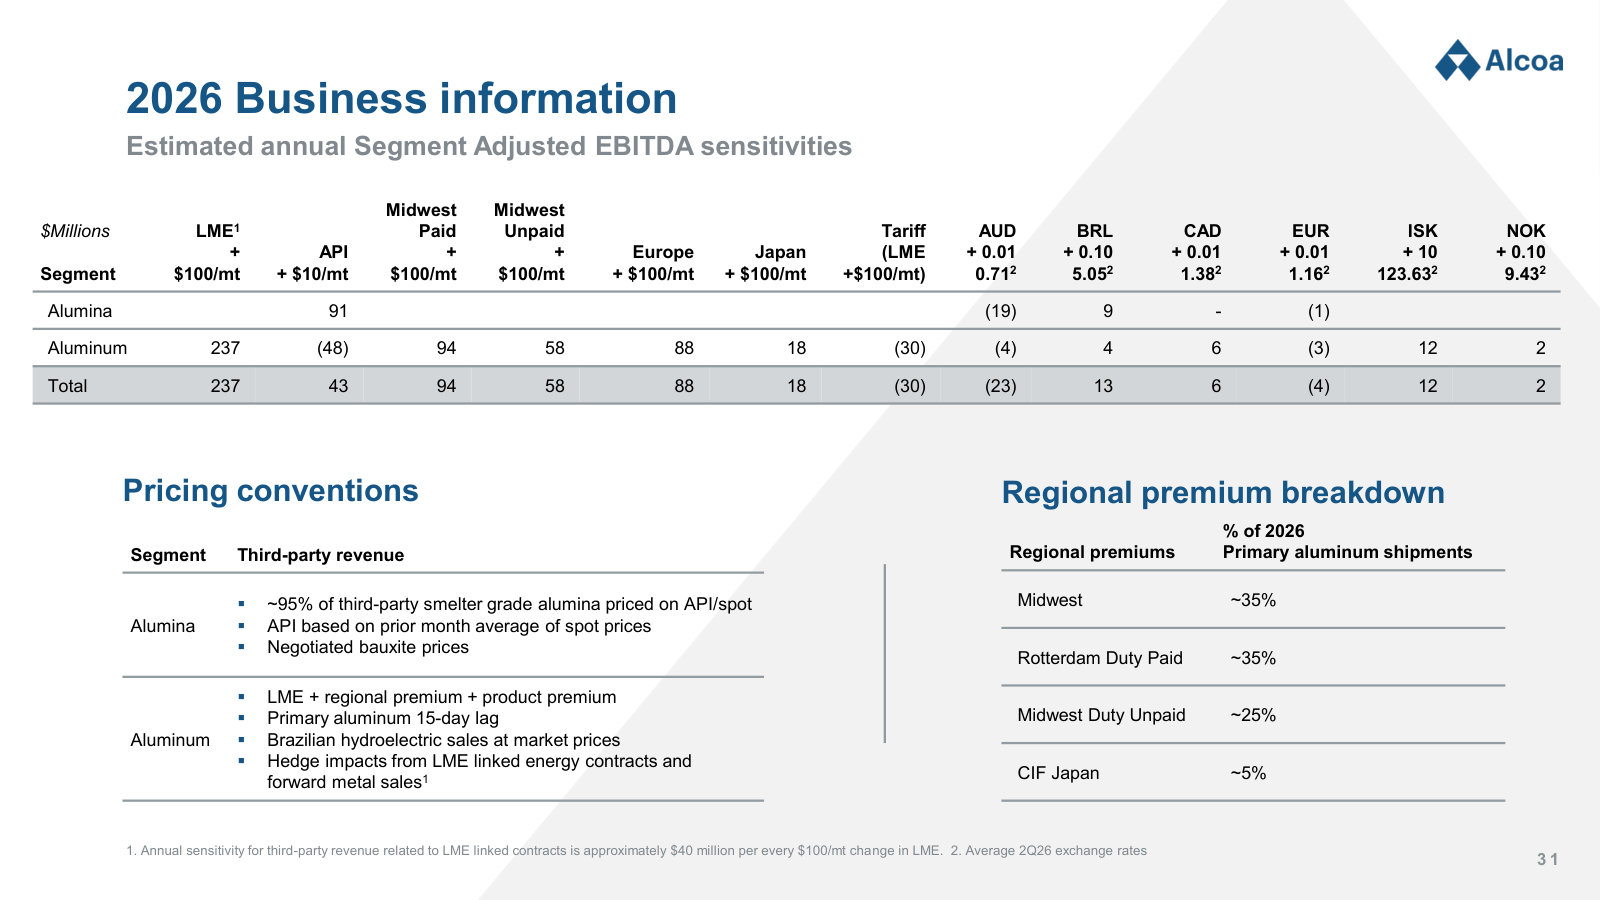
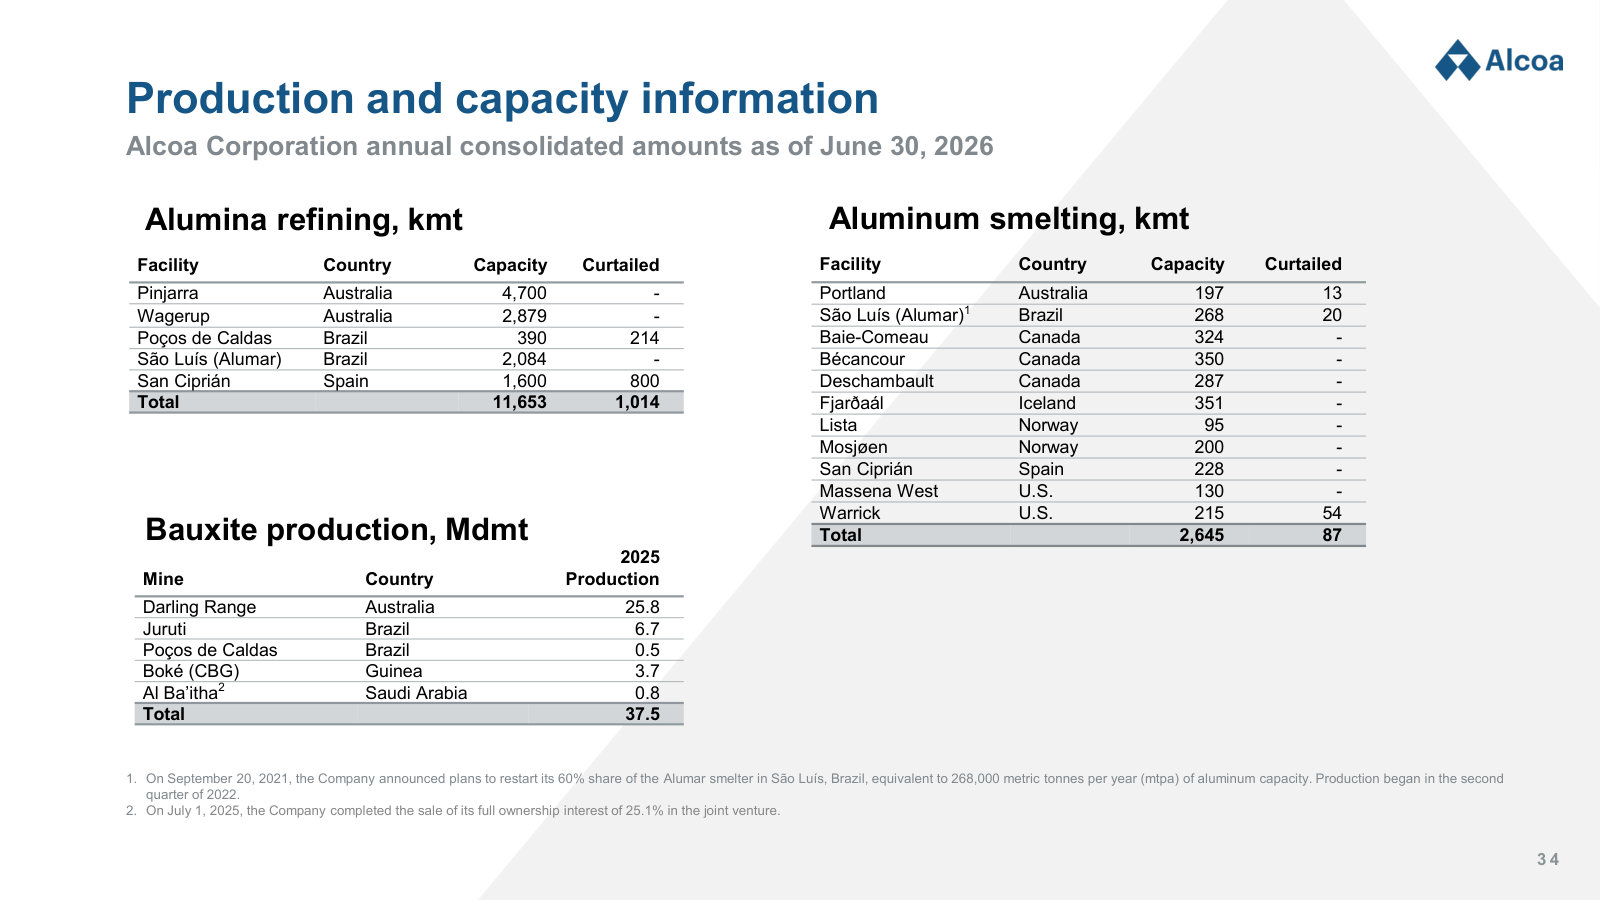
More from management
First Quarter 2026 Earnings Presentation — 1Q26 · 39 pages · The FY26 outlook and cost base as management framed them one quarter before the South32 deal was announced. · Open →
Alcoa Investor Presentation (March 2026) — Mar 2026 · 39 pages · The standing investor overview built on FY25 results, including the value-add product range and its end markets. · Open →
Fourth Quarter 2024 Earnings Presentation — 4Q24 · 44 pages · FY24 results and the 2025 outlook — the first full year after taking 100% of the AWAC joint venture. · Open →
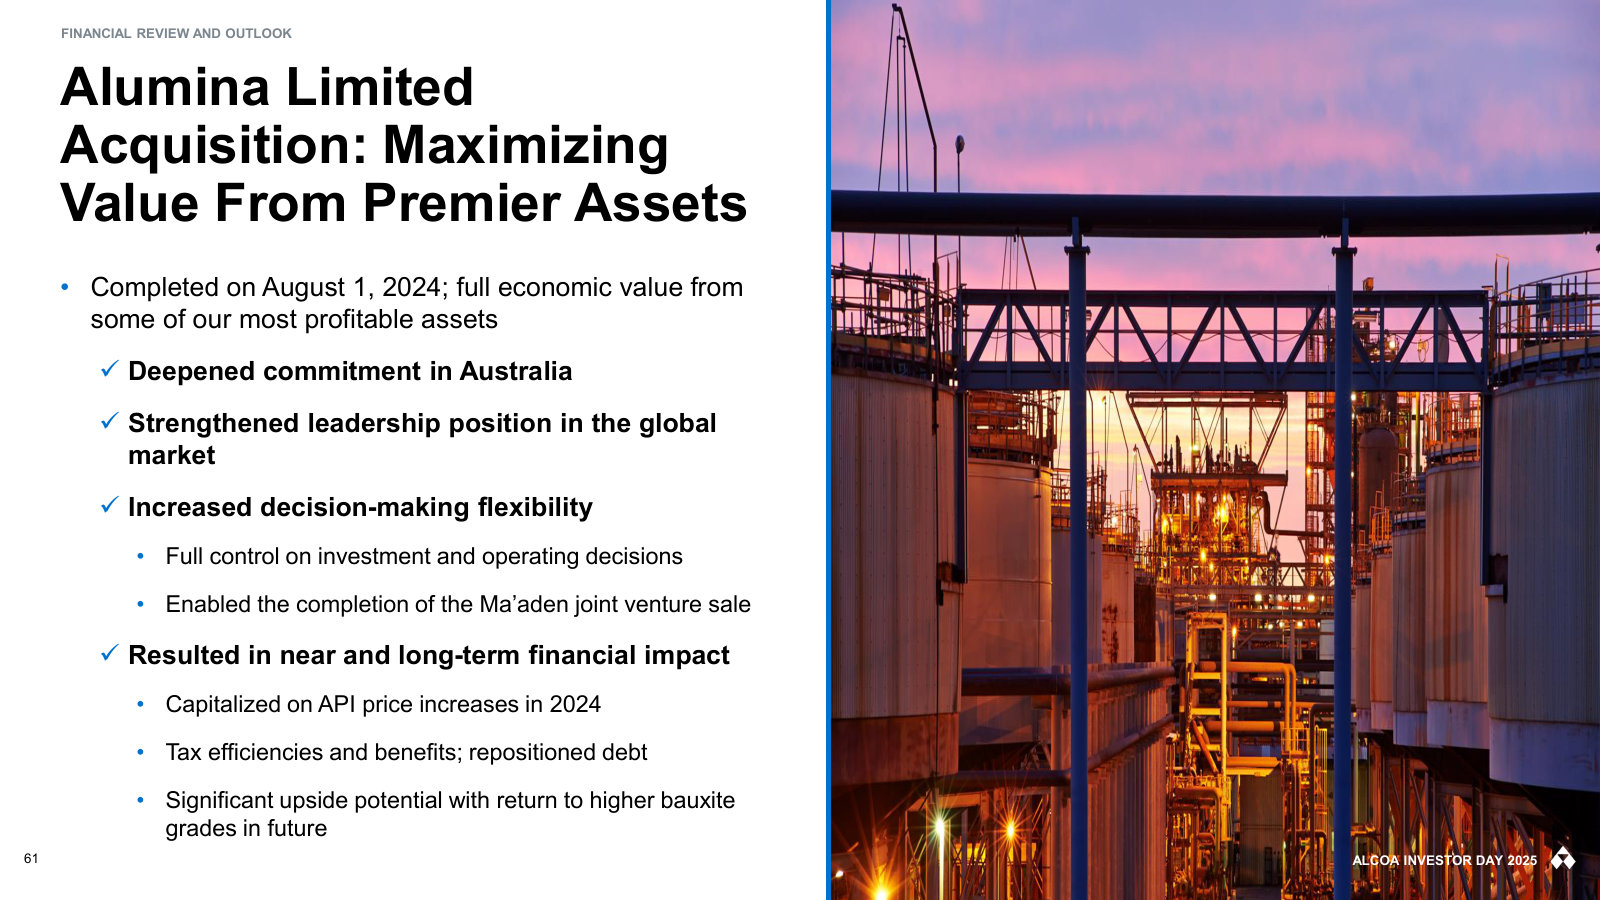
Acquisition of Alumina Limited — Feb 2024 · 24 pages · Why Alcoa bought out Alumina Limited and collapsed AWAC, the deal that made the Australian assets fully its own. · Open →
Alcoa Corporation's management answers for the business every quarter. These are the exchanges that explain it best — verbatim, from the call transcripts preserved in Sources. Each link opens the full transcript at that page in a new tab.
Q2 2026 Earnings Call — Q2 2026
The largest deal in Alcoa's history explained line by line — synergies, the cash/stock split, the lockbox, ticking fee and CVR — alongside a record aluminum quarter and the one timeline that could slip. · Open the full transcript →
The case for buying South32's upstream assets, with synergies management insists are bottom-up, not consultant math.
William F. Oplinger (President and Chief Executive Officer): This acquisition is about creating long-term shareholder value. First, the strategic fit is compelling. We are bringing together highly complementary assets that are mostly in close geographic proximity to our existing portfolio. This creates opportunities to improve performance by leveraging our combined expertise and scale. Second, the acquisition unlocks significant value through synergies. We have identified approximately $900 million of net present value synergies, including roughly $50 million of run-rate cost savings starting in the first year following closing. These synergies are backed by numerous initiatives identified during due diligence by our subject matter experts. The estimates are not high-level consultant projections. They are each highly actionable and based on areas where Alcoa has a demonstrated track record of execution. Third, the acquisition delivers compelling financial results. These assets enhance our ability to generate stronger cash flow through the cycle and improve our position on the global alumina and aluminum cost curves. We expect the acquisition to be accretive to our earnings per share and cash flow metrics immediately after close, with additional upside as synergies are captured over time.
p. 2 · Read in context →
Why a commodity buyer pays partly in stock: the equity and the CVR are deliberate risk-sharing, not a financing constraint.
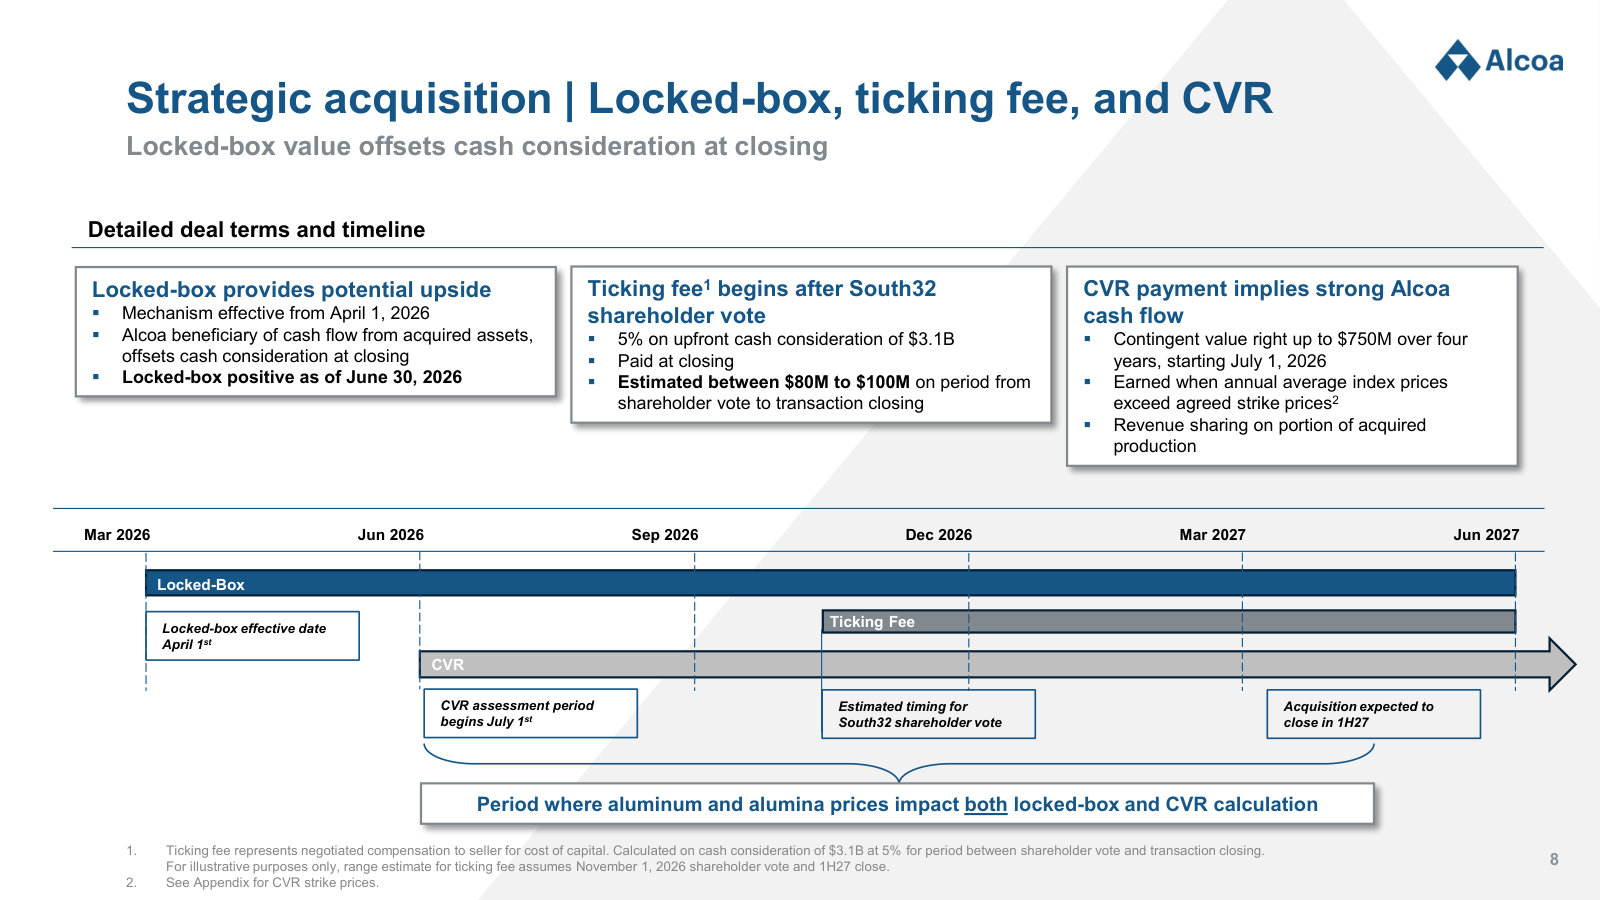
William F. Oplinger (President and Chief Executive Officer): Let me provide some additional context on the transaction based on questions we have received from investors about our rationale for the mix of cash and equity consideration—$3.1 billion and $1 billion, respectively. In our view, the stock consideration as well as the contingent value right provides for risk sharing between the buyer and seller. Commodity prices can and will change, and we believe this structure adapts to that dynamic, mitigating Alcoa's exposure to those market-driven value changes. This results in a fair transaction that is appreciated by both sets of shareholders.
p. 2 · Read in context →
The three mechanics that decide what Alcoa actually pays: locked box, ticking fee, and a $750 million capped CVR.
William F. Oplinger (President and Chief Executive Officer): Additionally, we want to clarify certain elements of the transaction structure, which includes three important components: the lockbox, the ticking fee, and the contingent value right or CVR. Starting with a locked box, this structure allows Alcoa to benefit from the cash flow generated by the acquired assets going back to 04/01/2026. As the assets generate cash, those amounts accrue to Alcoa and offset the cash consideration to be paid at closing. Based on publicly available information, we estimate the locked box to hold more than $200 million as of 06/30/2026. This value will fluctuate until closing; it gives a sense of the magnitude this mechanism could generate for Alcoa. Second, there is a ticking fee. Beginning after South32 shareholder approval, in October or November, we will pay a negotiated 5% annualized fee on the $3.1 billion cash consideration to compensate South32 for its cost of capital. We estimate approximately $80 million to $100 million in ticking fees to be paid at closing. Third, there is a CVR that aligns revenue sharing with market performance. If alumina or aluminum prices exceed agreed thresholds, South32 can participate in a portion of that upside, up to a maximum of $750 million over four years.
p. 2 · Read in context →
The buy-versus-build argument that underpins the deal: new refining and smelting capacity now costs more than the assets on offer.
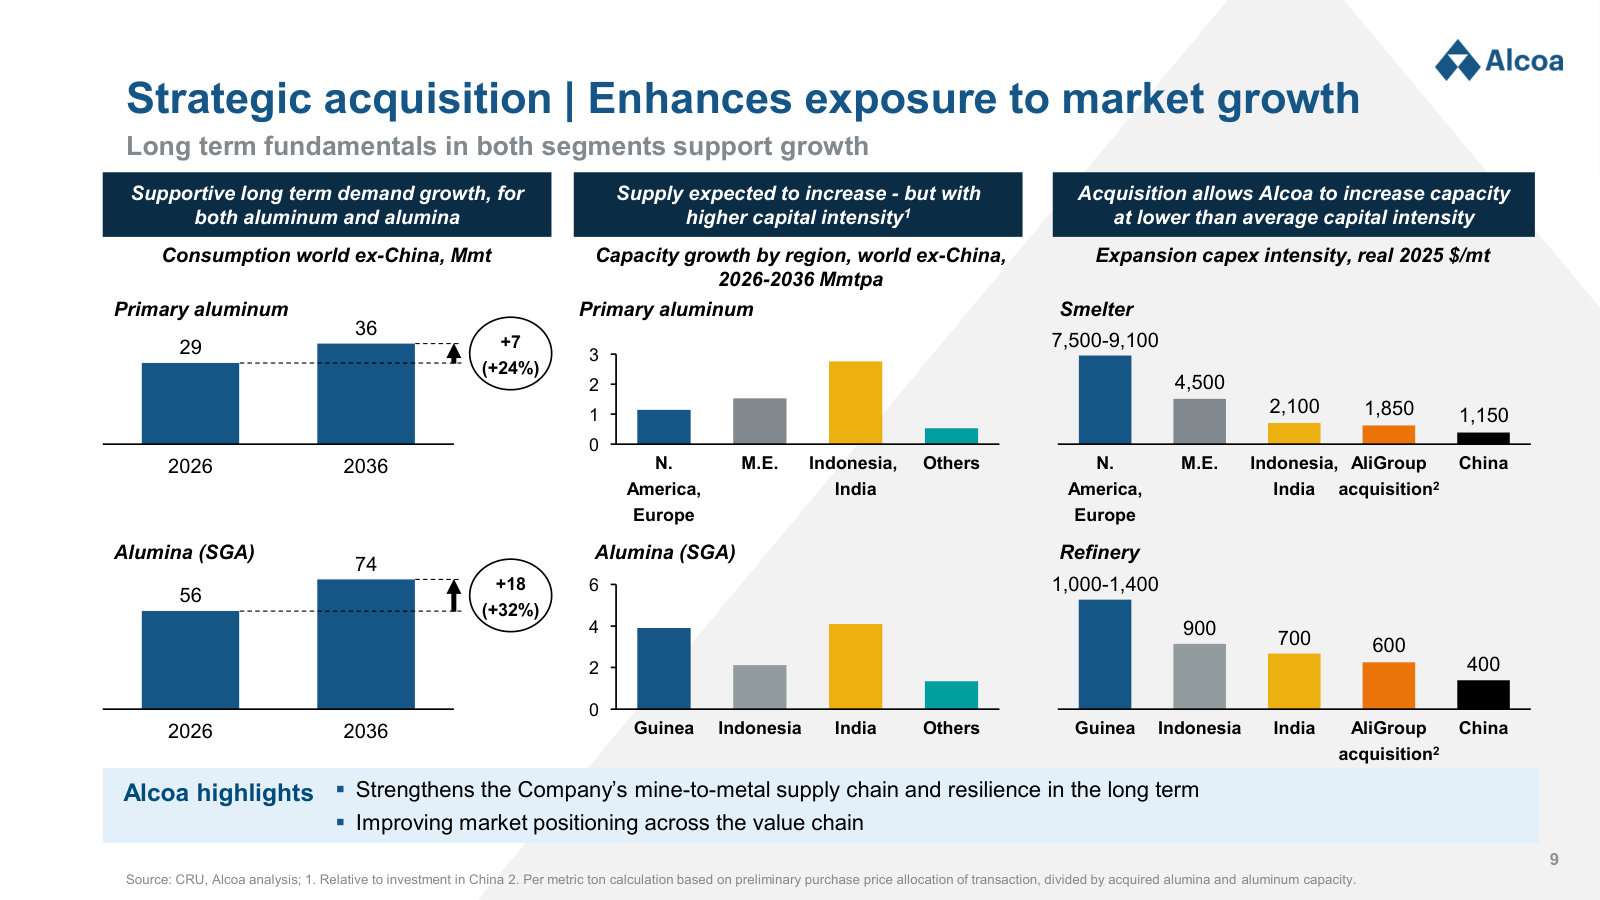
William F. Oplinger (President and Chief Executive Officer): At our Investor Day last year, we outlined our long-term view that the world will need more alumina and more aluminum driven by electrification, grid investment, transportation, packaging, and broader industrial growth. That thesis has not changed. Over the next decade, we expect primary aluminum demand outside of China to grow by approximately 7 million metric tons while alumina demand is expected to increase by approximately 18 million metric tons. […] The challenge is that new supply will be difficult and expensive to bring online. While we expect additional capacity to be built through restarts and expansions, the capital required to develop new refining and smelting capacity today is substantially higher than historical costs, especially when you compare with past expansions in China. […] Rather than spending years developing new assets, we are acquiring high-quality, large-scale operations that are already producing and integrated into the value chain. Importantly, we are acquiring that capacity at a valuation that is well below replacement cost.
p. 3 · Read in context →
How a record 32.3% aluminum margin was built — cast-house flexibility converting prime metal into premium-bearing product.
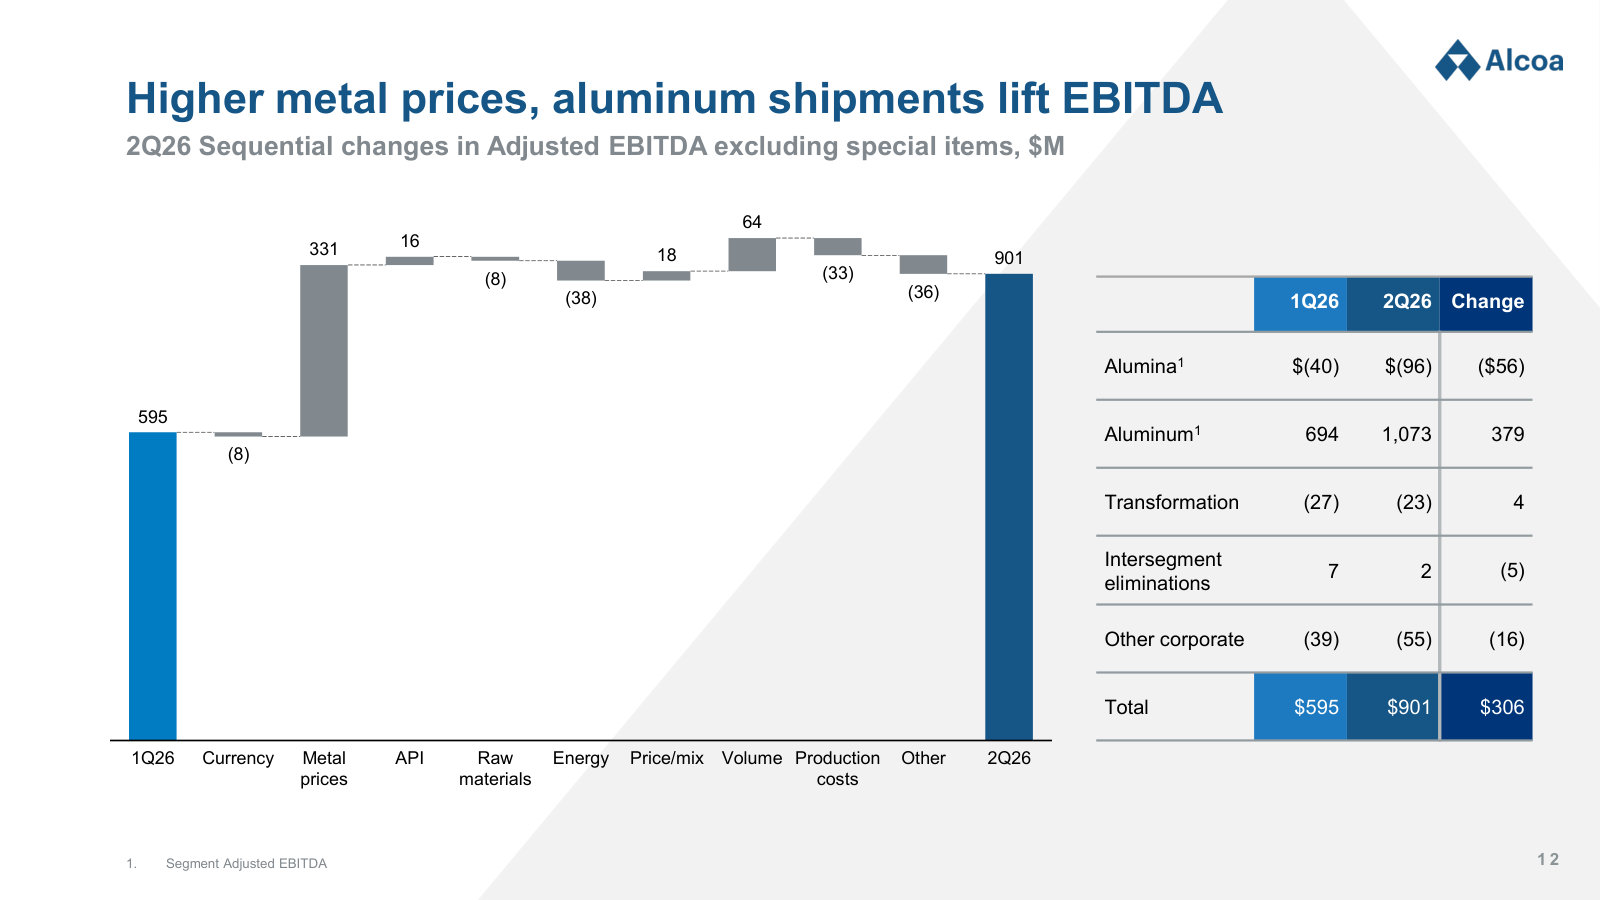
Molly S. Beerman (Executive Vice President and Chief Financial Officer): In the second quarter, the Aluminum segment delivered record segment adjusted EBITDA of $1.1 billion and an EBITDA margin of 32.3%. This reflects not only the benefit of higher metal prices, but also our ability to convert strong market conditions into bottom-line performance. Key contributors to this sequential performance were stable operations and disciplined cost management, effective production ramp-up, adding approximately 25 thousand metric tons of flexible casting capacity which converted approximately 30 thousand metric tons of prime metal into value-added product shipments with the added product premium, and overall strong shipping performance with 726 thousand metric tons delivered.
p. 4 · Read in context →
Asked why aluminum gave back its war premium, the CEO separates sentiment from fundamentals — and explains China running above its cap.
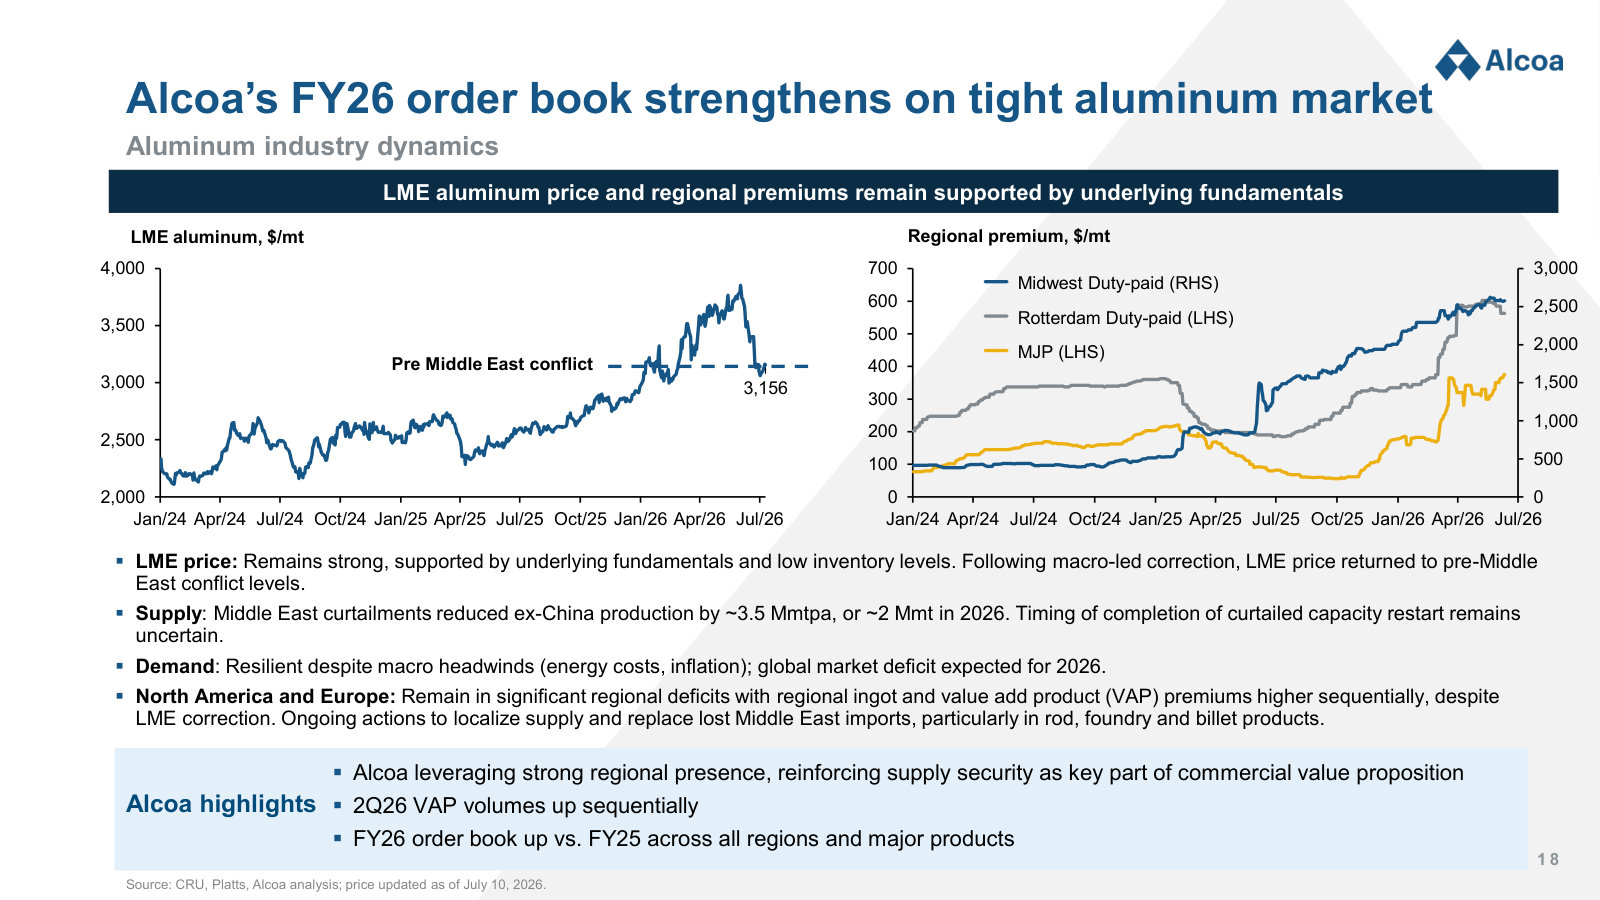
Timna Tanners (Analyst, Wells Fargo); William F. Oplinger (President and Chief Executive Officer): Hey, good evening. I wanted to take a step back and ask a little bit about, I know you referred to the aluminum price retreat, of course, of late and attributed it to macro factors. But your last slide deck talked extensively about the disruptions in the Middle East, and you alluded to them again this time, but yet the aluminum price, as you point out, has gone to pre-Iran conflict levels. So what do you attribute that to? And along those same lines, some people are worried about China contributing to that retreat and overproducing. What do you think is happening in China? […] So I will address both of those, Timna. The first answer is sentiment. The fundamentals from when the Iran conflict started have not fundamentally changed. So we believe at this point there is between three and 3.5 million metric tons of capacity offline within the Strait of Hormuz, and that caused prices to run up. Subsequently, when conflict resolution signals emerged, that caused prices to run down. Fundamentals have not really changed at this point. That capacity is still offline and as the Strait stays closed for longer, it becomes more difficult for the existing capacity in the region to continue to operate. So we believe it is sentiment driven. Within China, we are now projecting that China will run around 45 million metric tons of production during the course of the year. Yes, that is higher than the 45 million metric ton cap. We do not believe that is a signal of a change in philosophy within China. They have not opened up new capacity. This is just creeping utilization of the assets that they have given the higher metal price.
p. 8 · Read in context →
The Western Australia mining approvals: confidence in the outcome unchanged, but the year-end timeline is conceded as at risk.
Glyn Lawcock (Analyst, Barrenjoey); William F. Oplinger (President and Chief Executive Officer): Obviously, you spent the month of June here in Australia, obviously negotiating with South32. But obviously probably caught up with the EPA and other government agencies. Just any thoughts on how things are progressing now with regard to the permitting side? Anything you would want to call out? Or is it all still going well? […] Regarding the approvals, our approvals are continuing on the current path and are progressing well. When I was in Australia, I met with many of the key stakeholders of the process directly. My meetings reaffirmed my confidence in ultimately securing the mining approvals. That said, they also highlighted the number of important steps remaining in the process. As a result, while my confidence in the outcome remains unchanged, the timing could extend beyond our original expectations. You recall that we had said we would have our ministerial approval by the end of the year. If the approvals are delayed beyond that, we have contingency plans in place for various scenarios that would support the operations. We have built in contingency for a six-month delay where there will be no impact on supply and no expected impact on quality or cost. And if it goes beyond that, we have secondary contingency plans where we would consider modifying mining operations and flow rate at the refineries to avoid an ore gap.
p. 9 · Read in context →
San Ciprián's smelter now covers the refinery on EBITDA — the CFO is candid that the complex still burns cash.
Lawson Winder (Analyst, Bank of America Securities); William F. Oplinger (President and Chief Executive Officer); Molly S. Beerman (Executive Vice President and Chief Financial Officer): Congratulations on the ramp in Q2. With respect to the ramp, would you describe it as on schedule for your plans, in particular profitability by year-end 2027? And could you help guide us to where the EBITDA would have been in Q2 2026? […] Let me take it qualitatively, and Molly will give you some numbers. The ramp-up, once we restarted after the power outage last year, was—first of all—safe, and that is most important. Second of all, on time and on budget. So we were very pleased with the ramp-up performance of the San Ciprian smelter. We are also seeing that in today's environment tha is a competitive smelter. Ultimately, we need to have a power supply solution there. As you know, we have power through 2027. I was very pleased with the ramp-up in San Ciprian. […] During the second quarter, the EBITDA of the smelter did fully cover the refinery losses on an EBITDA basis. However, when you look at the whole site, it continues to consume cash with the refinery cash losses as well as the CapEx needed there for the residue storage area. And the smelter has consumed cash for working capital build in connection with the restart. So doing well on EBITDA at least from the complex as a whole, we still have work on cash.
p. 11 · Read in context →
Q1 2026 Earnings Call — Q1 2026
The clearest single explanation of how a Middle East shipping shock propagates through bauxite, alumina and metal — and why Alcoa's contracted energy book insulates the margin. · Open the full transcript →
Why a closed Strait of Hormuz is an aluminum problem: the region imports bauxite, anodes and coke, not just exports metal.
William F. Oplinger (President and Chief Executive Officer): Now let us look at the conflict in the Middle East and why it matters to the Alumina segment. The Middle East is the largest alumina importing region in the world, with supply routes for raw materials heavily dependent on the Strait of Hormuz. Each year, roughly 8.8 million tons of alumina and 6 million tons of bauxite transit through the Strait. That changed on February 27. As a result of the conflict, more than 2.5 million tons of annual smelting capacity and nearly 2 million tons of refining capacity are offline year to date. That is a meaningful disruption to the global system. Alumina refineries in the region are integrated with aluminum smelters. However, approximately half the region's bauxite requirements are imported from outside the Middle East. This structure leaves the regional aluminum system particularly exposed to shipping disruptions and logistical constraints. And it does not stop at bauxite and alumina. Several smelters in the region also rely on imported anodes, calcined coke, and coal tar pitch. With transit through the Strait restricted, those materials are harder to move, raising costs and increasing uncertainty. Given the Middle East's important role in global green petroleum coke exports, these disruptions are already rippling through the global calcined coke market. The takeaway is clear: structural dependencies in the Middle East mean that disruption there does not stay local. It moves quickly through the aluminum value chain, tightening supply, increasing cost volatility, and elevating risk well beyond the region itself.
p. 4 · Read in context →
The lag structure that governs refinery costs: caustic five to six months, carbon and freight later still.
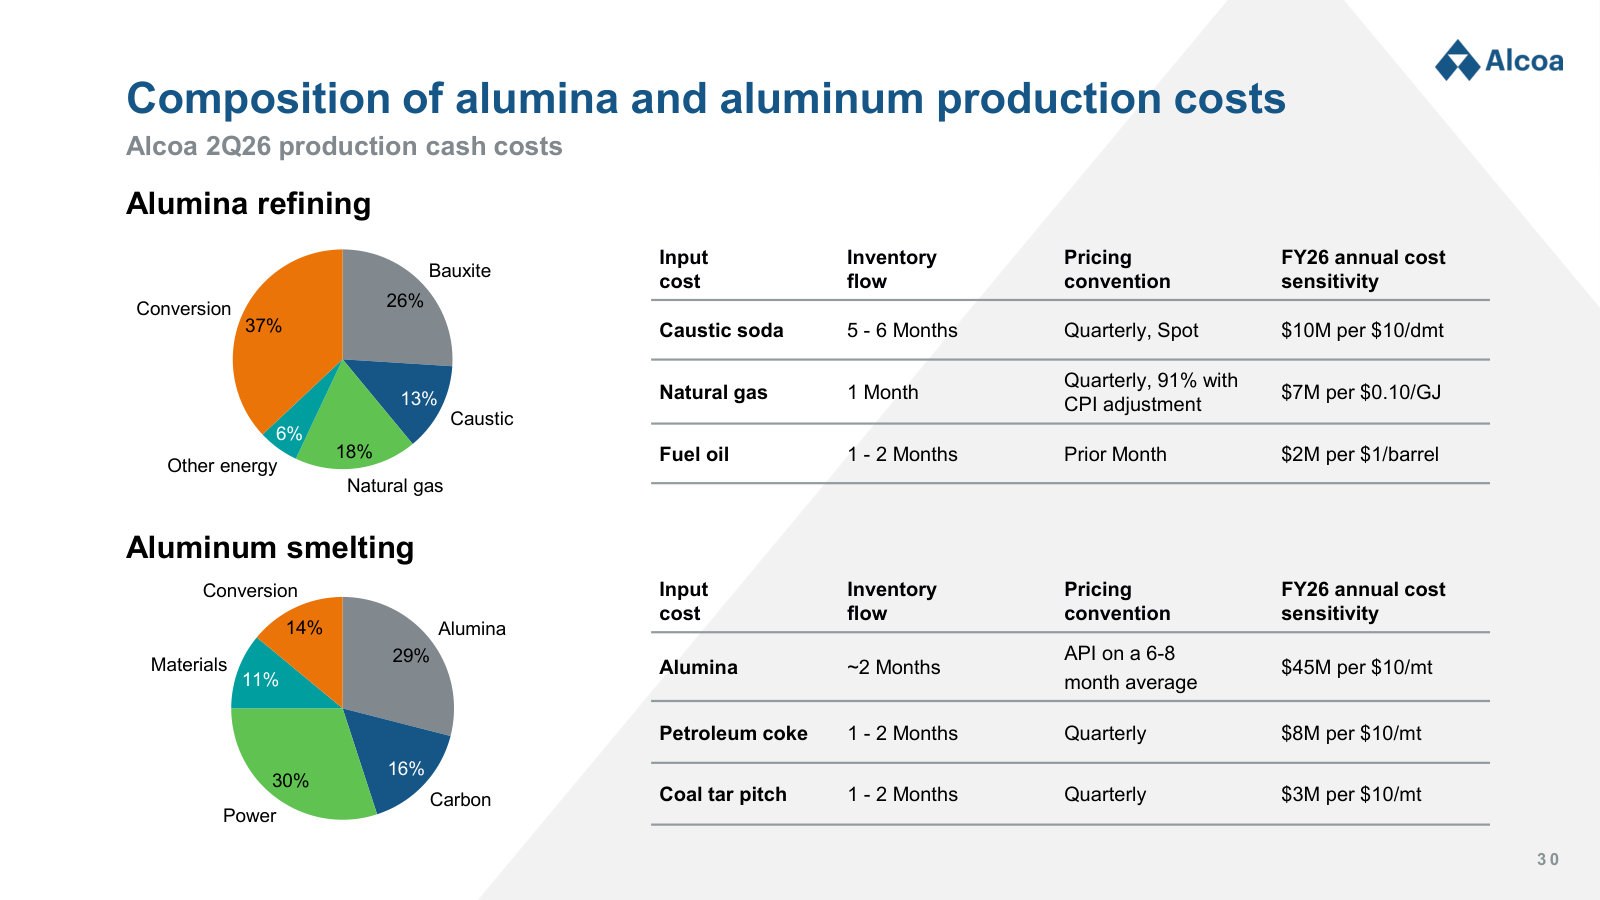
Molly S. Beerman (Executive Vice President and Chief Financial Officer): On raw materials in general, we do not have concerns at this point on supply. Our procurement and logistics teams have done a great job navigating the challenges of the conflict. We only have a small portion of caustic soda that we were sourcing from the Middle East, and that has already been redirected to alternate supply. On the price side, in addition to that diesel price that we talked about, we do expect to have price increases in the second quarter, but because of inventory lags, those purchase prices will not flow through to the P&L until beyond the second quarter. If you look at caustic, we do expect rising prices with the lower petrochemicals processing that impacts chlorine production, where caustic is a byproduct. Caustic is on a five- to six-month lag. Carbon prices are als rising due to higher green petroleum coke pricing and availability dynamics, so we will have some exposure there, but not within the second quarter. We also have elevated oil prices that are impacting our freight. There is a portion of that that will flow through, but it will be fairly small. A lot of the freight cost goes into inventory; again the lag, so that will be experienced a bit later.
p. 6 · Read in context →
Asked directly whether San Ciprián runs profitably, the CFO says the restarted smelter cannot yet carry the refinery.
Katja Jancic (Analyst, BMO Capital Markets); Molly S. Beerman (Executive Vice President and Chief Financial Officer): And on San Ciprián, given that it is now restarted, in the current environment do the operations— both refinery and smelter—run profitably? […] It is embedded in the guide that we have provided. On your point about product mix, yes, that is right—less P1020 and more value-add supports higher premiums. The smelter is doing very well now that it has completed the full restart. Unfortunately, though, we are continuing to have significant losses at the refinery, and within 2026, the smelter will not generate enough cash flow to cover the refinery’s free cash flow losses. We remain on our plan, we are meeting our commitments under the viability agreement, and we are working toward our objective of achieving a neutralization of our cash flows there by 2027. But at current pricing, the refinery remains very challenged.
p. 7 · Read in context →
Substitution economics against copper, steel and PET — and why management equates hitting the net-debt target with maximum firm value.
Timna Tanners (Analyst, Wells Fargo); William F. Oplinger (President and Chief Executive Officer): I wanted to circle back on some comments that Bill made last quarter about substitution of aluminum for copper. Do you have any observations on that dynamic given the change in prices, and anything you are seeing on substitution away from aluminum given the rise in price as well? And on capital allocation, the last couple of months’ dynamics have changed and potentially a bigger amount of free cash flow—any updated thoughts or any timeframe when you might have updated thoughts on allocation of that additional cash or key uses going forward? […] At a high level, with copper pricing where it is, there are still real reasons to substitute into aluminum. Aluminum prices have gone up sharply in this conflict, but we believe there are still good reasons to substitute into aluminum. On the other side, on the margin, we have seen some small substitution out of aluminum into steel for applications that can do that. But the larger automotive applications—because they are multiyear platforms—we have not seen that substitution yet. And when you consider things like packaging, the alternative is PET, and with oil prices at current levels, PET would not look attractive to substitute for aluminum. On capital allocation, I get excited about getting into our target net debt level. Our leverage ratios are low; getting into that range translates to the lowest WACC, and once you have the lowest WACC, you have the highest firm value.
p. 10 · Read in context →
What restarting one idled potline actually costs — $100 million, one to two years, and a power question that outranks the tariff.
Nick Giles (Analyst, B. Riley Securities); William F. Oplinger (President and Chief Executive Officer): Can you clarify how you are thinking about Warrick in terms of a restart? What would it take from here for you to move forward, and do you have any rough estimate for the CapEx requirements? […] Warrick—glad you asked. We talked about restarting capacity in Australia, the ramp-up in Brazil, ramping up capacity in Lista, and we just completed the ramp-up at San Ciprián. So you should be asking about those 50 thousand tons at Warrick. First, the condition of the curtailed line at Warrick is pretty poor. It will require about $100 million of capital, and we think it will be one to two years for that restart. There are some long lead time items, specifically around the electrical equipment, required to restart Warrick. On paper, the restart looks positive at this point. However, we are weighing availability of short-term and long-term electricity, and our ability to successfully run that plant at a four-line operation safely.
p. 11 · Read in context →
Q4 and Full Year 2025 Earnings Call — Q4 2025
The policy-economics call: who actually bears the Section 232 tariff, how CBAM nets out for a European producer, and why no one is building greenfield smelters. · Open the full transcript →
CBAM worked through end to end: importers buy certificates, domestic producers pay via ETS, Alcoa nets roughly +$10 per tonne.
William Oplinger (President and Chief Executive Officer): Industry analysts estimate that CBAM could add roughly $40 per metric ton to the Rotterdam premium in 2026, and we believe some of this uplift was already included into 2025. While CBAM certificates affect foreign importers, domestic European producers do not purchase CBAM credits and instead experience cost changes through the emissions trading system framework, or ETS, which sets the carbon cost for all domestic producers. Current free allowances under that program will be fully phased out by 2034, pushing carbon costs of domestic producers higher. However, Alcoa's European smelters are advantaged when compared to higher-emitting producers due to their lower Scope 1 direct emissions, driven by modern pot technology and strong operational stability. This makes our cost increase comparatively lower than competitors. Overall, based on our internal analysis, we expect CBAM to generate a net positive impact of approximately $10 per metric ton in 2026, with the uplift in the Rotterdam premium outweighing our carbon cost increases.
p. 5 · Read in context →
How a low-cost producer plays a trough: cut costs, but not so hard that the plants are compromised — and let the cost curve do the work.
Carlos De Alba (Analyst, Morgan Stanley); William Oplinger (President and Chief Executive Officer): My first question is regarding the alumina profitability. Clearly, they are under pressure, maybe at the bottom, depending on how things play out. But the profitability for that business unit or that segment for you guys has come down. Based on the guidance, probably it's going to be breakeven. Give or take. So can you talk about what the plans are to potentially come out with initiatives to reduce cost if possible, improve productivity, efficiencies, and just to enhance the profitability of that segment? […] So I'll address it. And if, Molly, if you want to add anything. Clearly, we understand where we are in the cycle alumina. And we've shown in the past, Carlos, that we can get pretty aggressive around costs. Now what we won't do this time around is really put any of our plants in jeopardy for the future. And we have a low-cost position on the cost curve. And there are other plants around the world, specifically in China, that are much higher on the cost curve. So they will be under pressure. Their margins will be under significant pressure at these levels.
p. 6 · Read in context →
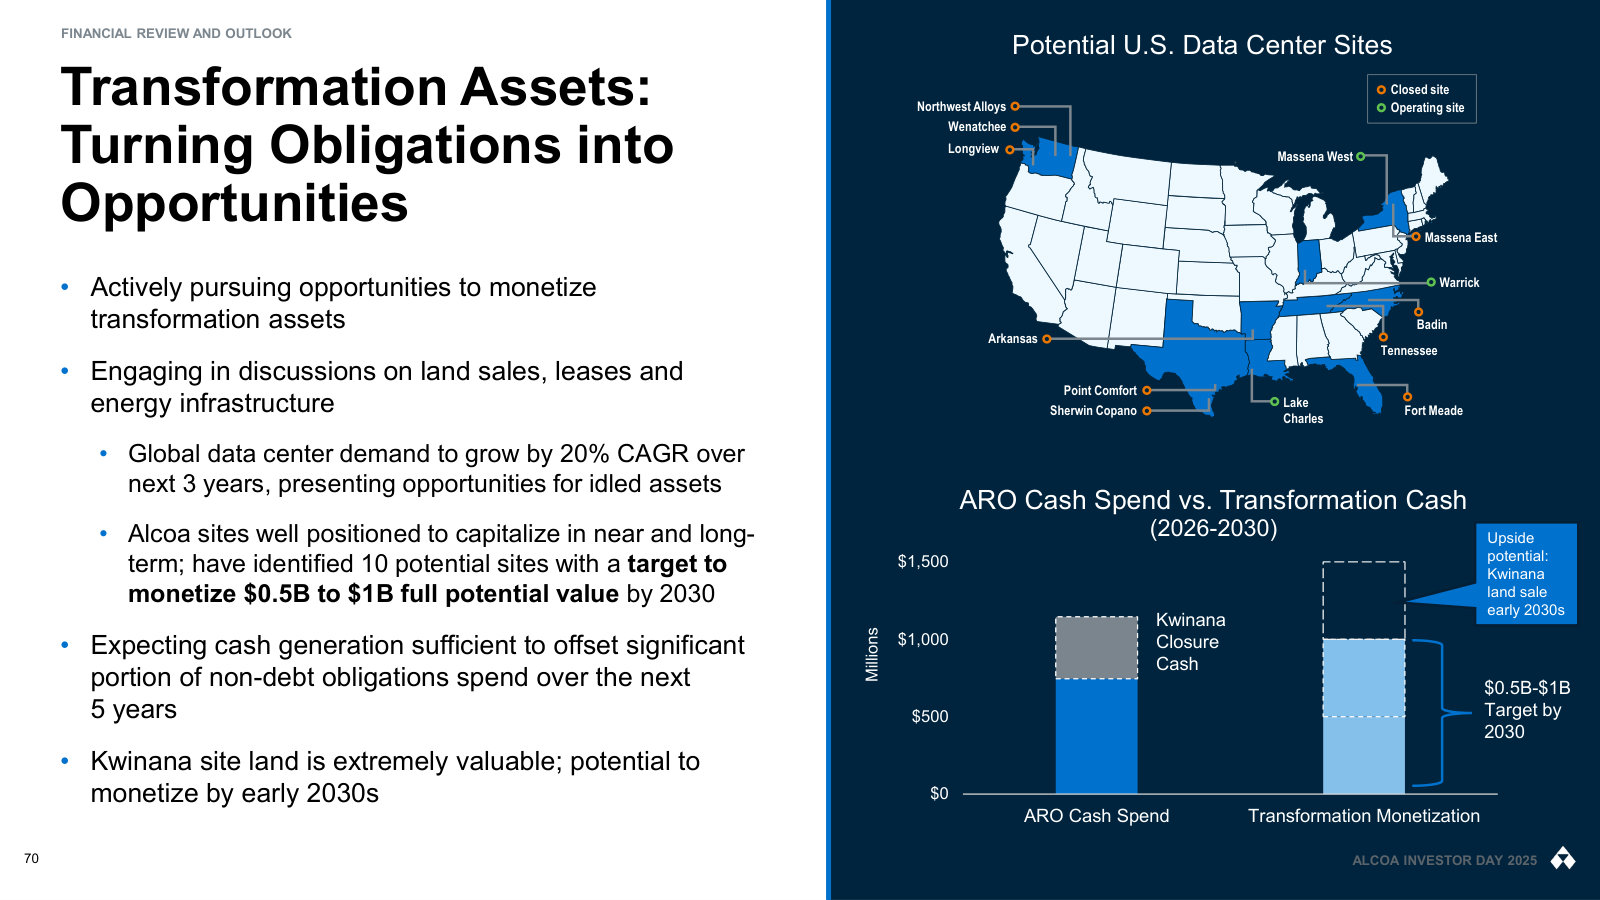
Not land sales: ten priority properties, multi-year payment streams, $500 million to $1 billion targeted.
Molly Beerman (Executive Vice President and Chief Financial Officer): The negotiation for the primary site that we're working on now, it's taking longer because it is not a simple land sale. This particular negotiation could involve a multi-year payment stream as well as some value-sharing structures. We're going to take our time and get this right, make sure we get the most value, so that's the slight extension on the timing there. We are continuing to progress several other sites. You know, we have 10 priority sites in total to meet our target of $500 million to $1 billion over the next five years.
p. 6 · Read in context →
The full San Ciprián arithmetic: 2026 losses quantified, and the CO2 compensation timing that gets the complex to cash neutral in 2027.
Katja Jancic (Analyst, BMO Capital Markets); Molly Beerman (Executive Vice President and Chief Financial Officer): And then maybe shifting to San Ciprian, given the current alumina and aluminum environment, if the operation would be at full capacity, would the operation generate, would the EBITDA be positive? […] For the smelter, we will reach profitability after we complete the restart, and that is still on track for 2026. The pricing is very favorable there. We are still working on our overall program for the complex, and I can give you an update on our EBITDA guidance for '26 for the combined smelter and refinery. So we have an EBITDA loss of approximately $75 to $100 million, the majority of that is the refinery. Our free cash flow consumption will be approximately $100 to $130 million, and that includes refinery CapEx of about $50 million. […] In Spain, we do not record the CO2 compensation until it is earned, and recall there's a three-year clawback. So we will have cash receipts of about $85 million coming in the '27 for our '26 production. So that's why we still have confidence that by the '27, we will have reached our neutrality goal.
p. 7 · Read in context →
Over $1 billion of gross tariff a year — and the Midwest premium has risen enough to pass all of it to customers.
Glyn Lawcock (Analyst, Barrenjoey); William Oplinger (President and Chief Executive Officer): Okay. That's great. And then maybe just I don't know if you've mentioned it, but just the Canada tariff exemption. I mean, how long is a piece of string, but just any updates on discussions there? Or is it still something too hard to call? […] I think it's very hard to call with all the geopolitical changes that are going on around the world, Glyn. It's difficult to say whether there will be a Canadian exemption. The Midwest premium obviously has risen to cover the total tariff expense. As a company, we're probably spending over $1 billion in gross tariff expense on an annual basis, but the Midwest premium is high enough to cover that. So the tariffs in their entirety are getting passed on to customers at this point.
p. 8 · Read in context →
Just inside the net-debt target, the priority order: stay in range, sustain the assets, then split cash between returns and growth.
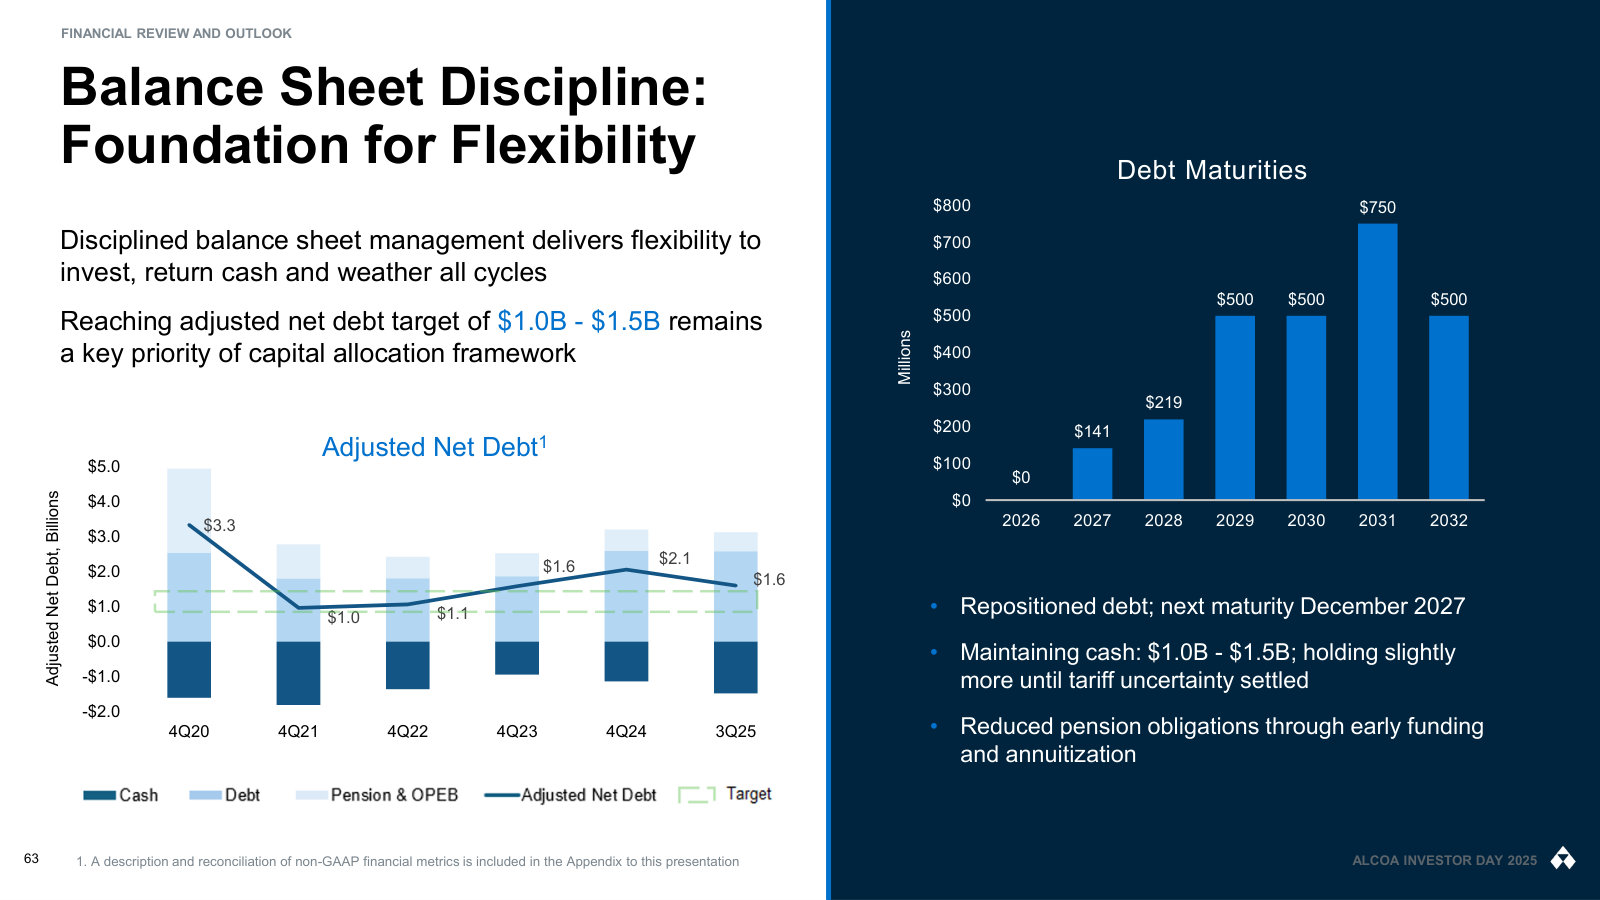
Lawson Winder (Analyst, Bank of America); Molly Beerman (Executive Vice President and Chief Financial Officer); William Oplinger (President and Chief Executive Officer): So we did just get under the target at $1.46 billion. So again, as we said in our comments, our goal is not only to stay with to get to the range, but to stay within it throughout our cycles. And as we mentioned, we're going to consume cash in the first quarter that will be related to both working capital and tax payments. We do expect to generate cash across 2026. And that will be used for additional debt repayments. Recall we still have $219 million on our 2028 notes. We will expect to have excess cash to compete between shareholder returns and value-creating growth opportunities. […] If I would just add to that, it all starts with a rock-solid balance sheet. And we are now within our target range. But a fundamental belief on our part is that one of the strengths of our company is that we need to have a fortress balance sheet, and we're within the range. Beyond that, we have the sustaining capital that we'll spend to sustain the cash flow that we get from the operations. And then as Molly said extremely well, it's going to be a mix between returns to shareholders and growth.
p. 9 · Read in context →
Restart versus buy versus build — the CEO says no location on earth offers energy cheap enough to justify a greenfield smelter.
Lachlan Shaw (Analyst, UBS); William Oplinger (President and Chief Executive Officer): My second question, so you just gave a bit of a color there in terms of the existing portfolio and potential optionality to restart? But if I sort of step back look at the aluminum market, roll forward a year or two, trade seems likely to be tightening. When you look at the options around restarting versus buying versus building, I mean, how are you seeing those sorts of trends right now? […] It really depends on what product line that you're looking at. So remember that we have three different product lines, bauxite, alumina, and aluminum. At this point, we do not have greenfield expansion plans for aluminum, and we've not found anywhere around the world that provides a sufficiently low energy price for sufficient returns on a greenfield plant at this point. In the case of refining and bauxite, very similar. Refining capital costs are still fairly high. And certainly at today's prices, it makes it difficult for a greenfield expansion. Now with that said, we do have brownfield opportunities to potentially grow in both mining, refining, and smelting. But at this point, we don't have significant greenfield plans going forward.
p. 10 · Read in context →
Q1 2025 Earnings Call — Q1 2025
The tariff-shock call: the first full accounting of Section 232 on Canadian metal, the structural math of the U.S. aluminum deficit, and the net-debt target that still governs capital allocation. · Open the full transcript →
Where the $1.0–1.5 billion adjusted net debt target comes from — investment-grade metrics held through the whole cycle, not just the peak.
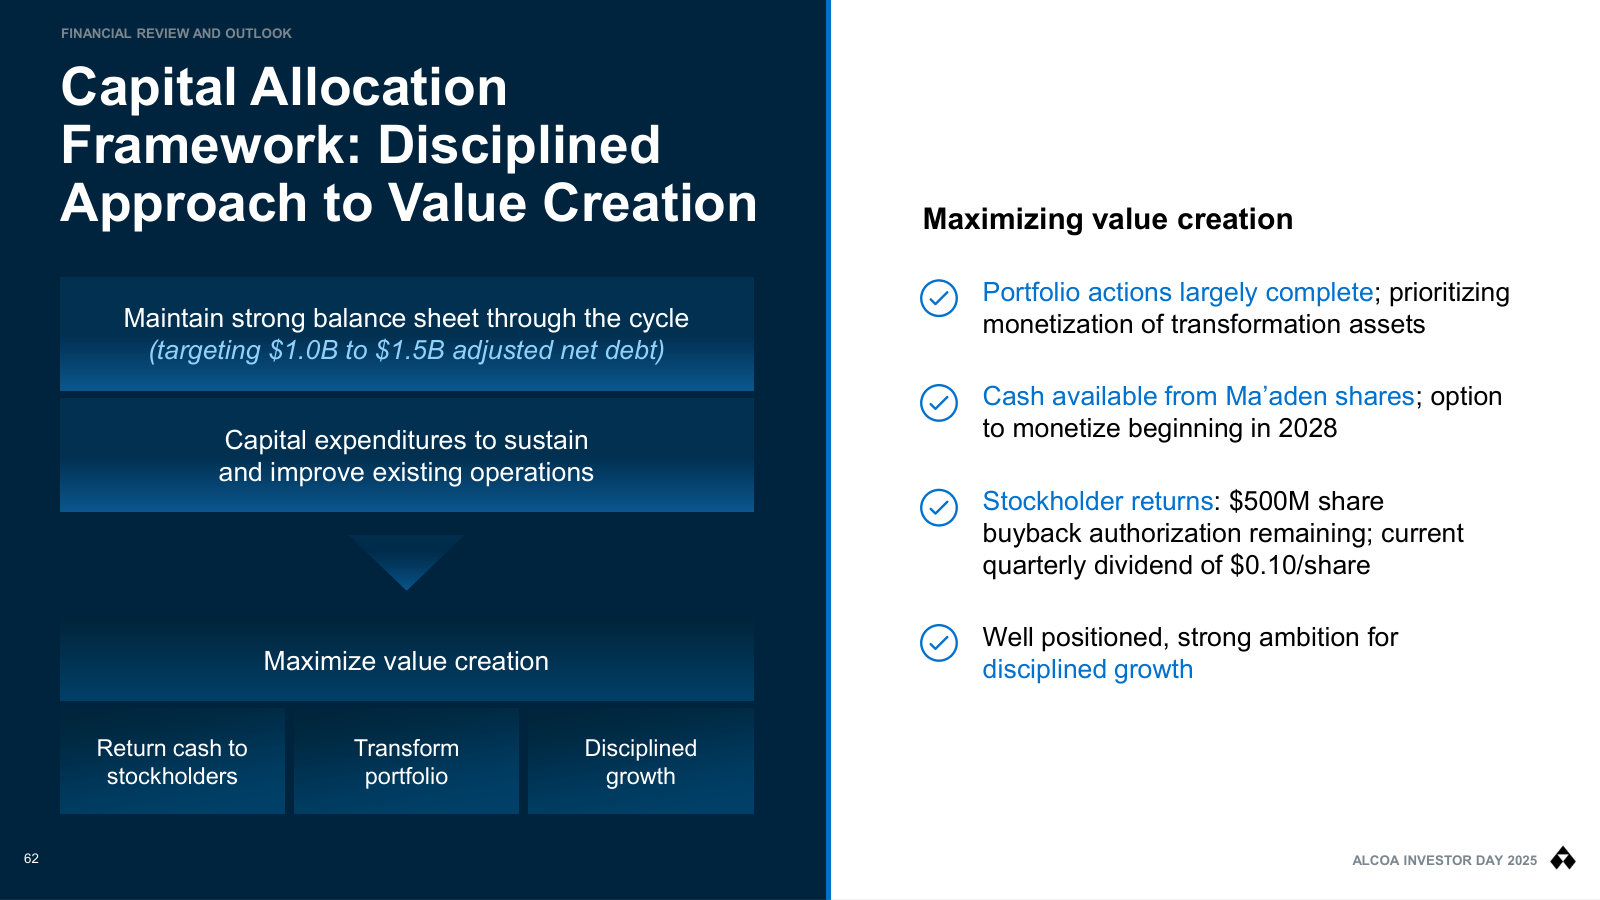
Molly Beerman (CFO): Our overall capital allocation framework remains unchanged. It starts with maintaining a strong balance sheet throughout the cycle, and sufficiently funding our operations to sustain and improve them. The optimal capital structure for our company is reached when investment-grade leverage metrics are achieved reducing our WACC and creating value for our stockholders through a higher company valuation, lower cost of financing, and improved project viability. We want to maintain investment-grade leverage metrics throughout all business cycles not only at the mid or top part of the cycle. Based on this, we first defined a target for adjusted debt which includes pension and OPEB liabilities. This target is $2.1 billion to $2.5 billion. Then considering our historical use rate of cash, we target a cash balance between $1 million and $1.5 million. Netting the cash with the adjusted debt, results in our targeted range of adjusted net debt of $1 billion to $1.5 billion.
p. 2 · Read in context →
The direct hit: 70% of Canadian production goes to U.S. customers, $400–425 million of annual tariff, ~$100 million net after the premium.
William Oplinger (President and CEO): The U.S. Section 232 tariff structure has been in place for some time, in March, the tariff increased from 10% to 25% and the exemption for Canadian metal imported into the U.S. was removed. This is the most material impact on Alcoa, as approximately 70% of our aluminum produced in Canada is destined for U.S. customers. We are now subject to 25% tariff cost, which totals an estimated $400 to $425 million annually. Of course, there is a higher Midwest premium, which offsets some of this cost and certainly benefits our U.S. smelters but currently the net annual result is approximately $100 million negative for our business.
p. 3 · Read in context →
Why the U.S. cannot smelt its way out: restarting every idle pot still leaves a 3.6 million tonne gap.
William Oplinger (President and CEO): In 2024, the U.S. imported approximately 4.2 million metric tons of primary aluminum, with imports of Canadian aluminum representing approximately 70% or 2.9 million metric tons. The four operating smelters in the U.S. produce 700,000 metric tons of aluminum each year. If all idle smelting capacity in the U.S. were to restart, which is approximately 600,000 metric tons, the U.S. would still be short by 3.6 million metric tons. It takes many years to build a new smelter and at least five to six smelters would be required to address the U.S. demand for primary aluminum. These new smelters would require additional energy production equivalent to almost seven new nuclear reactors or more than ten Hoover Dams. Until additional smelting capacity is built in the U.S., the most efficient aluminum suppl chain is Canadian aluminum flowing into the U.S.
p. 3 · Read in context →
The cost-curve read that sets the floor under alumina: with bauxite high and prices low, over 80% of Chinese refineries are underwater.
William Oplinger (President and CEO): With bauxite prices remaining relatively high, and the current lower alumina price, we estimate that over 80% of Chinese refineries are unprofitable. Additionally, a recent announcement by the Chinese government stated that there would be higher scrutiny on new alumina projects regarding air pollution control, off-site sourcing, and red mud processing, which could bring additional constraints on growth in Chinese alumina production and may accelerate curtailment. This is a dynamic market and Alcoa's global network of refineries provides security and supply of alumina both to Alcoa smelters and our major customers, which are primarily in the milling.
p. 4 · Read in context →
The San Ciprián funding envelope made explicit: $70–90 million of EBITDA loss, $90–110 million of cash, with hedges bounding the downside.
Chris LaFemina (Analyst, Jefferies); Molly Beerman (CFO); William Oplinger (President and CEO): So if we're looking at, I don't know, $100 million to $120 million of negative cash flow from the restart of the smelter in 2025, what happens beyond 2025? How do the hedges help? And then secondly, I think there was, you know, the guidance had been that if you burn through roughly $200 million at San Ciprian comes to a point where you just can't continue to subsidize this? And does this hedging strategy that you refer to here protect you from that over the 2025 to 2027 period? […] Fortunately, we did start to put the hedges in place several weeks ago, and we have secured hedge pricing that will help us to manage the cost within the funding envelope. We are focused year by year on 2025. We released the guidance for the smelter. We expect to lose about $70 million to $90 million in EBITDA. The cash used by those operations will be about $90 million to $110 million. The CapEx that we referred to is already included in our CapEx guidance.
p. 6 · Read in context →
Q2 2024 Earnings Call — Q2 2024
The call on the eve of the Alumina Limited acquisition, with San Ciprián weeks from running out of cash and the $645 million self-help program mid-flight. · Open the full transcript →
The vote that consolidated AWAC: Alumina Limited approved by Alcoa holders, close set for August 1.
William Oplinger (CEO): Before we get to all the good work we have done in the quarter, I'm pleased to say that we are nearing completion of the Alumina Limited acquisition. We held the Alcoa Stockholder Meeting yesterday and Alcoa stockholders have voted overwhelmingly to approve issuing Alcoa shares for the transaction. The Alumina Limited Shareholder meeting occurs in a few hours and we expect a favorable result there as well, which would lead to an expected transaction closing date of August 1. As you've heard me say before, we believe that this transaction is the right deal for both sets of shareholders and we look forward to realizing its benefits and welcoming Alumina Limited shareholders into Alcoa.
p. 1 · Read in context →
A concrete piece of unit economics: buying four ships to cut $14–16 per tonne of alumina out of Brazilian bauxite freight.
Molly Beerman (CFO): The first half of 2024 capital expenditures include an investment of $38 million, which is a portion of our commitment to purchase two vessels to provide bauxite transportation in Brazil. Two additional vessels will be leased. We have an opportunity for significant reductions in bauxite freight cost between our Juruti mine and Alumar refinery. We estimate savings to be $14 to $16 per tonne of alumina. The first vessel arrived in Brazil this week with an additional three ships to be received later this year. We hired a contract operator with considerable expertise in the region to manage the technical operations on our behalf.
p. 1 · Read in context →
What low-carbon actually means in this industry, and why the scarcity of low-carbon refinery projects is the durable part of the story.
William Oplinger (CEO): For primary aluminum to be truly lowcarbon, it needs to be low-carbon from mine to metal. We offer our low-carbon EcoLum Primary Aluminum, which is produced with less than 4 tonnes of carbon dioxide equivalents per ton of aluminum produced, including Scope 1 and 2 emissions from mining, refining, smelting, and casting. And the world's only low-carbon alumina brand, EcoSource, which has a carbon footprint under 0.6 tonnes of CO2 per tonne of alumina, including Scope 1 and 2 emissions from mining and refining. However, when considering likely alumina refinery projects, there are very few low-carbon alumina projects in the global pipeline and none that we expect to come online before 2030.
p. 3 · Read in context →
How an alumina deficit clears: either smelters curtail or refineries ramp — there is no third path.
Michael Dudas (Analyst, Vertical Research); William Oplinger (CEO): Bill, maybe you can share your thoughts on the alumina market. And obviously with all the dynamics that's occurring, how does this environment compare to other environments you've witnessed with spiking and capacity issues? Is this something that has a little bit more sustainability? […] So the alumina industry today is in a fairly unique situation. We exited the second quarter in a deficit to the tune of around globally for the industry, about a 3 million metric ton deficit. For the full year, we're anticipating that alumina will be in deficit. So it's a situation that is very tight and we're seeing it around the world. The only way that deficit gets solved obviously is if either smelters curtail or we get ramp-ups in alumina; there's really two things that drove that deficit in the near-term. One was supply issues from some of our competitors, specifically in Northern Australia and in China. So as we look forward, that market only comes back into balance if those supply issues are solved.
p. 6 · Read in context →
Inside the $645 million improvement program: raw-material lags, hundreds of tracked initiatives, and 6% cut from every budget.
Molly Beerman (CFO): So on the improvement programs, a couple more points on the raw materials. There aren't necessarily additional actions that we have to take. We are negotiating now on the purchase prices that we're seeing now are going to deliver the year-over-year improvement. Recall, we're on those lags in inventory. So the six months in caustic and the three months on coke and pitch, so good line of sight to realize that with the contracts that we have in place now. As far as the productivity and competitiveness program, we have already identified lists of hundreds of initiatives. They are being executed now. Internally, we're tracking that against revised budgets. Everyone across the company, all the budget managers have lost about 6% of their budgets. So they are adhering to those. And so that's how we're monitoring the $100 million program there.
p. 11 · Read in context →
More calls
Q3 2025 Earnings Call — Q3 2025 · 13 pages · Go here for the energy bar management actually uses — $30–40 per megawatt hour for a smelter versus data centers paying $100 — plus the Massena ten-year power contract, the permanent closure of Kwinana, the Ma'aden stake sale and the three-government gallium project. · Open →
Q2 2025 Earnings Call — Q2 2025 · 11 pages · The quarter Section 232 doubled to 50% and the Ma'aden joint-venture sale closed; useful for how the Midwest premium responded as the tariff rate stepped up. · Open →
Q4 and Full Year 2024 Earnings Call — Q4 2024 · 14 pages · The full-year recap of the turnaround year — Alumina Limited integrated, Kwinana curtailed, nine of eleven smelters up — set against record alumina prices. · Open →
Q3 2024 Earnings Call — Q3 2024 · 14 pages · The first quarter reported with 100% of AWAC consolidated, during the 2024 alumina price spike — the cleanest look at what full ownership does to segment economics. · Open →
Q1 2024 Earnings Call — Q1 2024 · 14 pages · Where the Alumina Limited deal terms were first laid out — the 0.02854 exchange ratio, the ~$2.2 billion implied equity value, and why the AWAC minority structure was worth collapsing. · Open →
Q4 and Full Year 2023 Earnings Call — Q4 2023 · 30 pages · The trough call: full-year return on equity of negative 8.9%, the decision to curtail the 60-year-old Kwinana refinery, a revolver covenant amendment, and analysts pressing on whether the dividend was safe. · Open →
Q3 2023 Earnings Call — Q3 2023 · 31 pages · Oplinger's first call as CEO, laying out the initial diagnosis of the portfolio's underperforming assets before the 2024 restructuring actions were taken. · Open →
Q2 2022 Earnings Call — Q2 2022 · 31 pages · The top of the cycle for contrast — $913 million of quarterly EBITDA, $275 million of buybacks and a fresh $500 million authorization, just before European energy costs broke the model. · Open →
Alcoa Corporation's annual reports contain management's most considered account of the business. These are the sections, passages and visual pages worth opening in the originals preserved in Sources.
Alcoa Corporation — FY2025 Annual Report (Form 10-K) — FY2025
The latest full account: two segments, asset-by-asset capacity, and the mine-approval and San Ciprián issues management calls decisive. · Open the full document →
Item 1. Business — The Company — p. 3 · Read the full section →
The opening definition of the business: two segments, 25 operating locations, and revenue set by two published indices rather than by Alcoa.
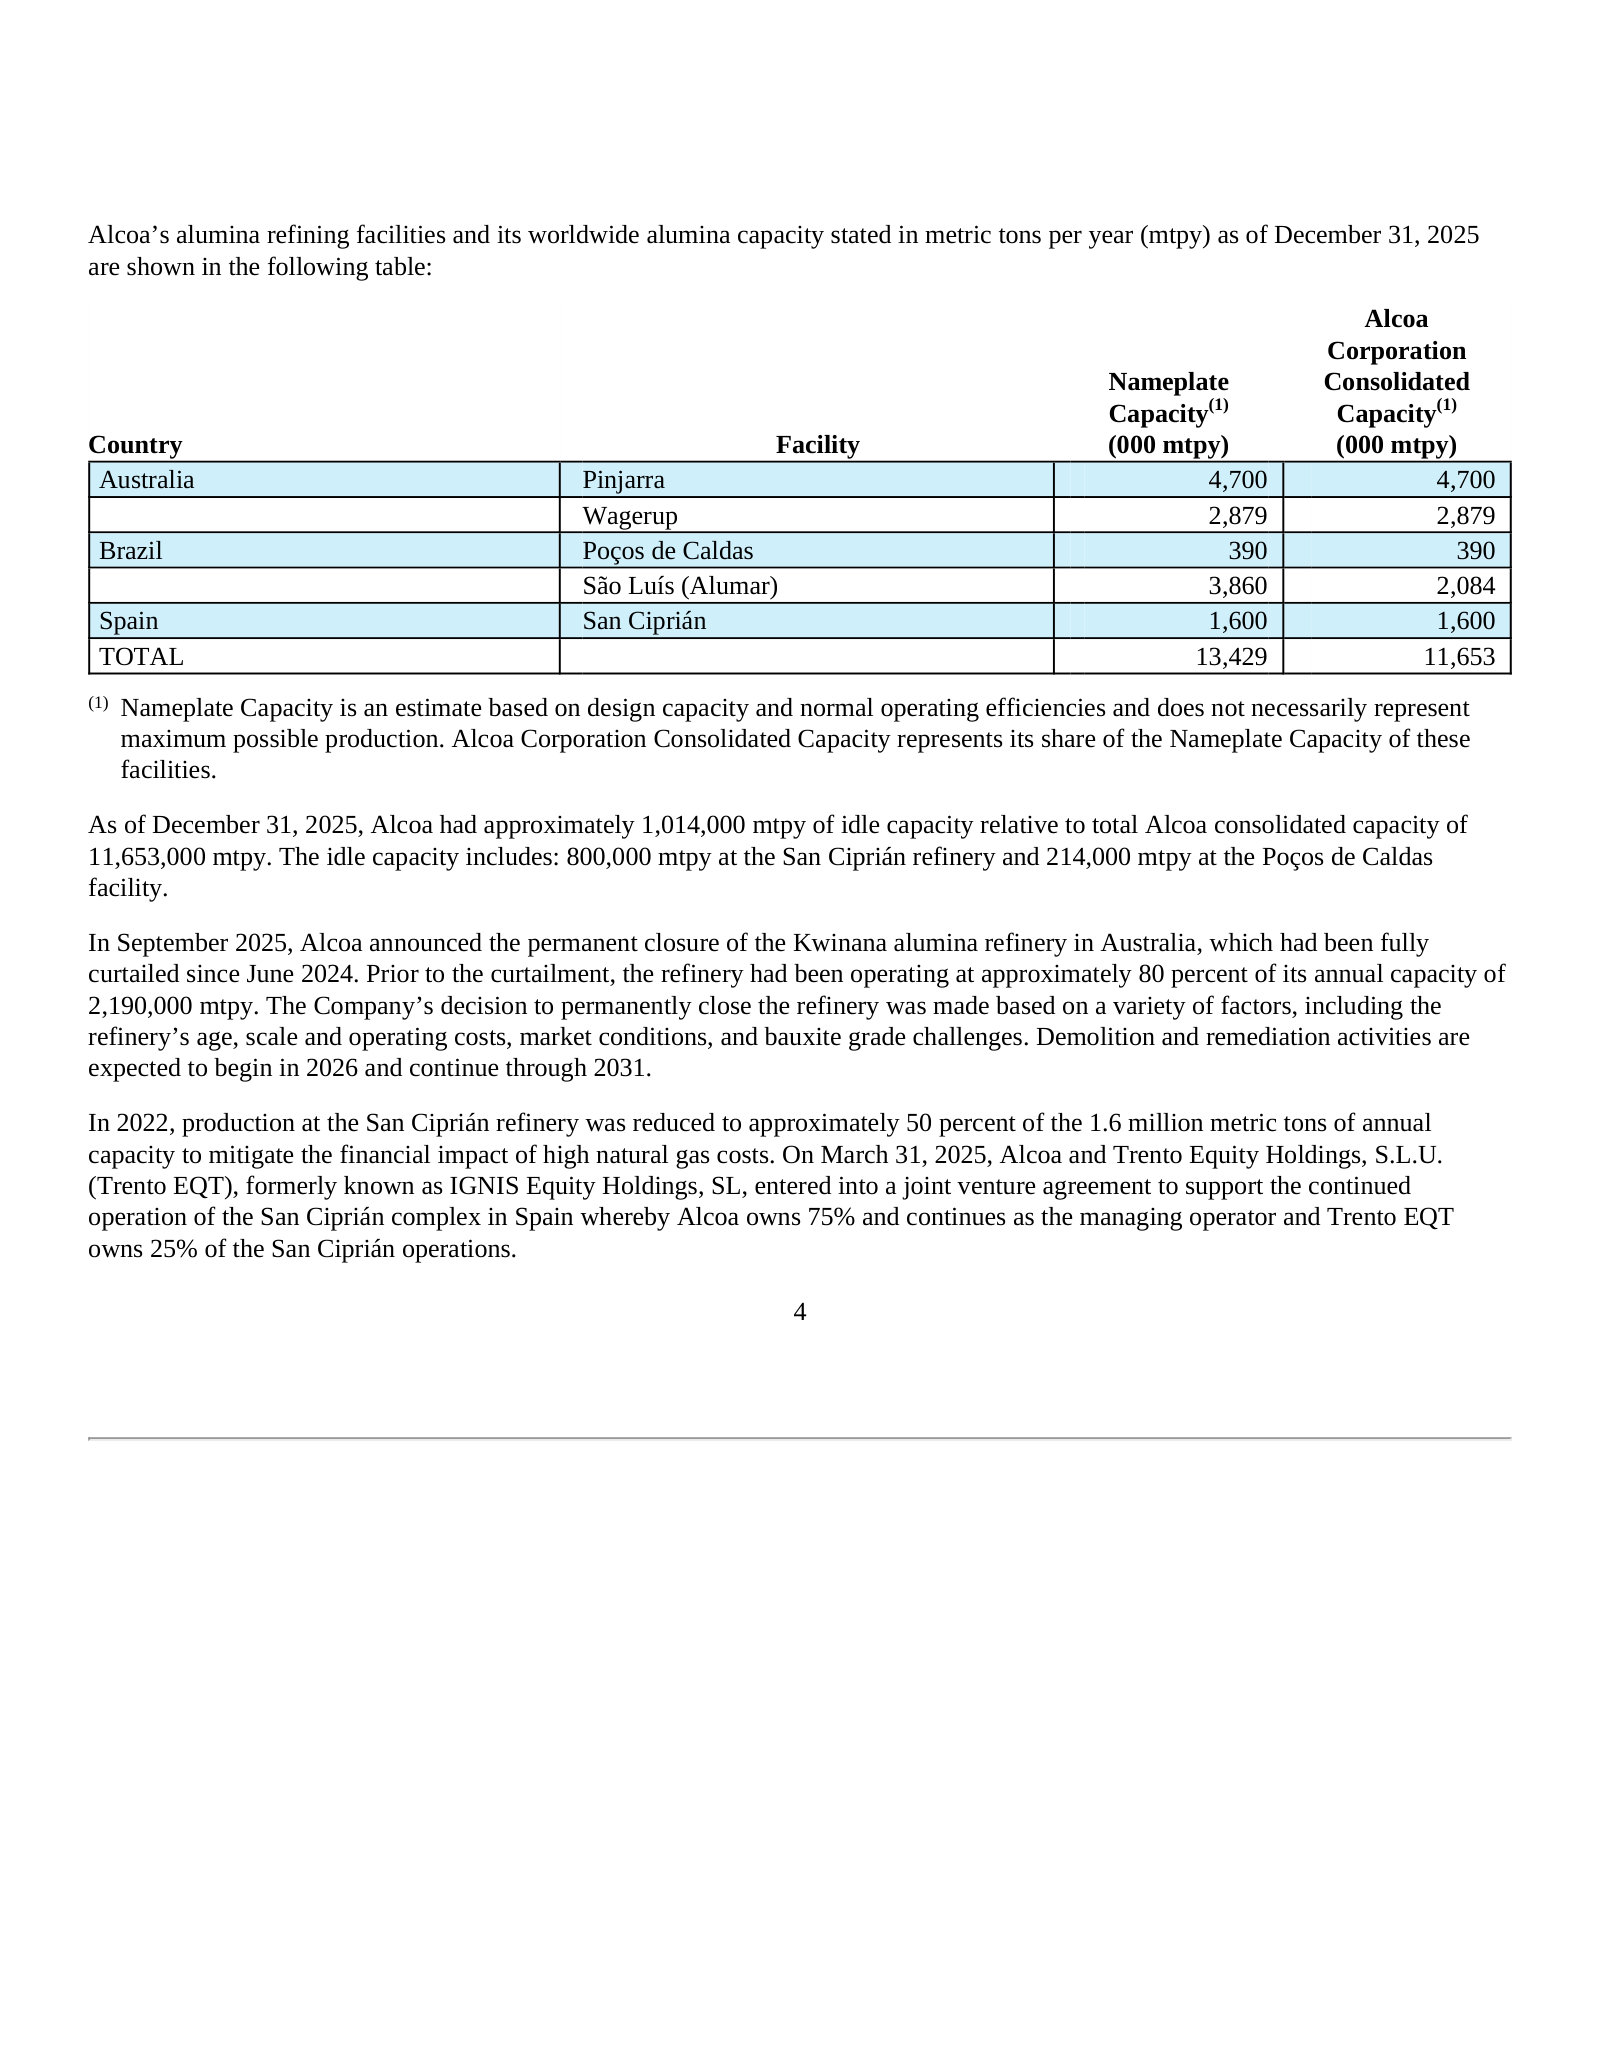
Alumina — p. 6 · Read the full section →
The upstream half of the company, and the clearest statement of how alumina is priced and how much of it is sold to Alcoa's own smelters.
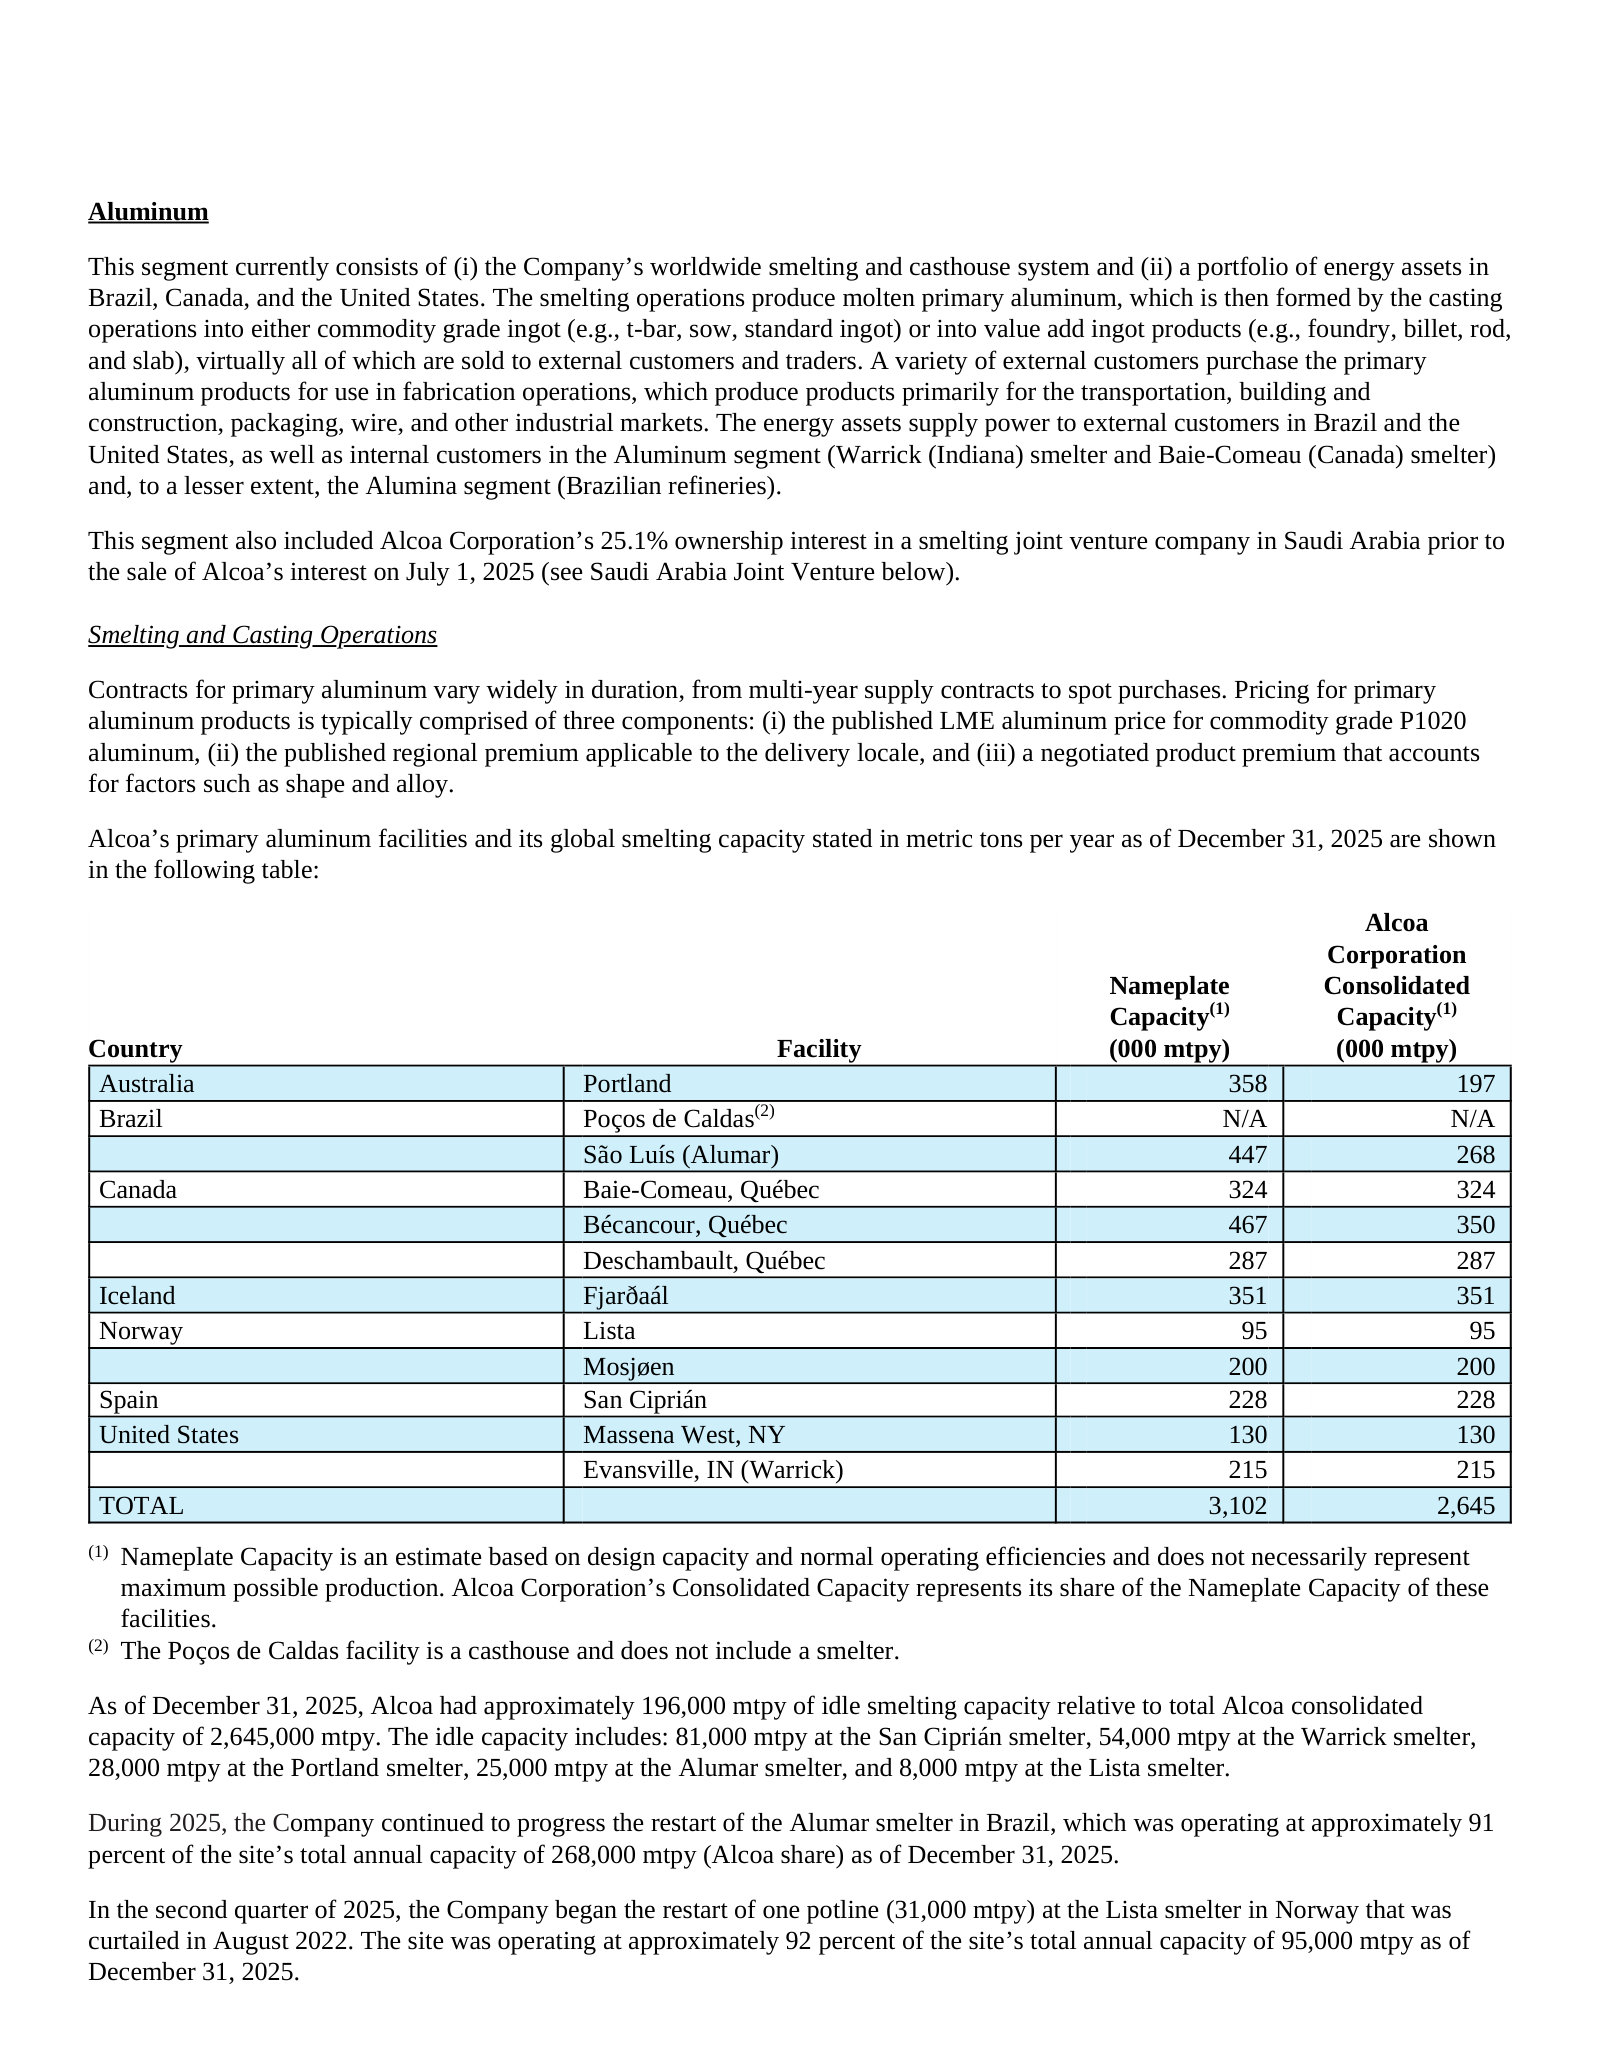
Aluminum — p. 8 · Read the full section →
The downstream half: the three-part price a smelter actually realizes, and the idle capacity that sits behind restart optionality.
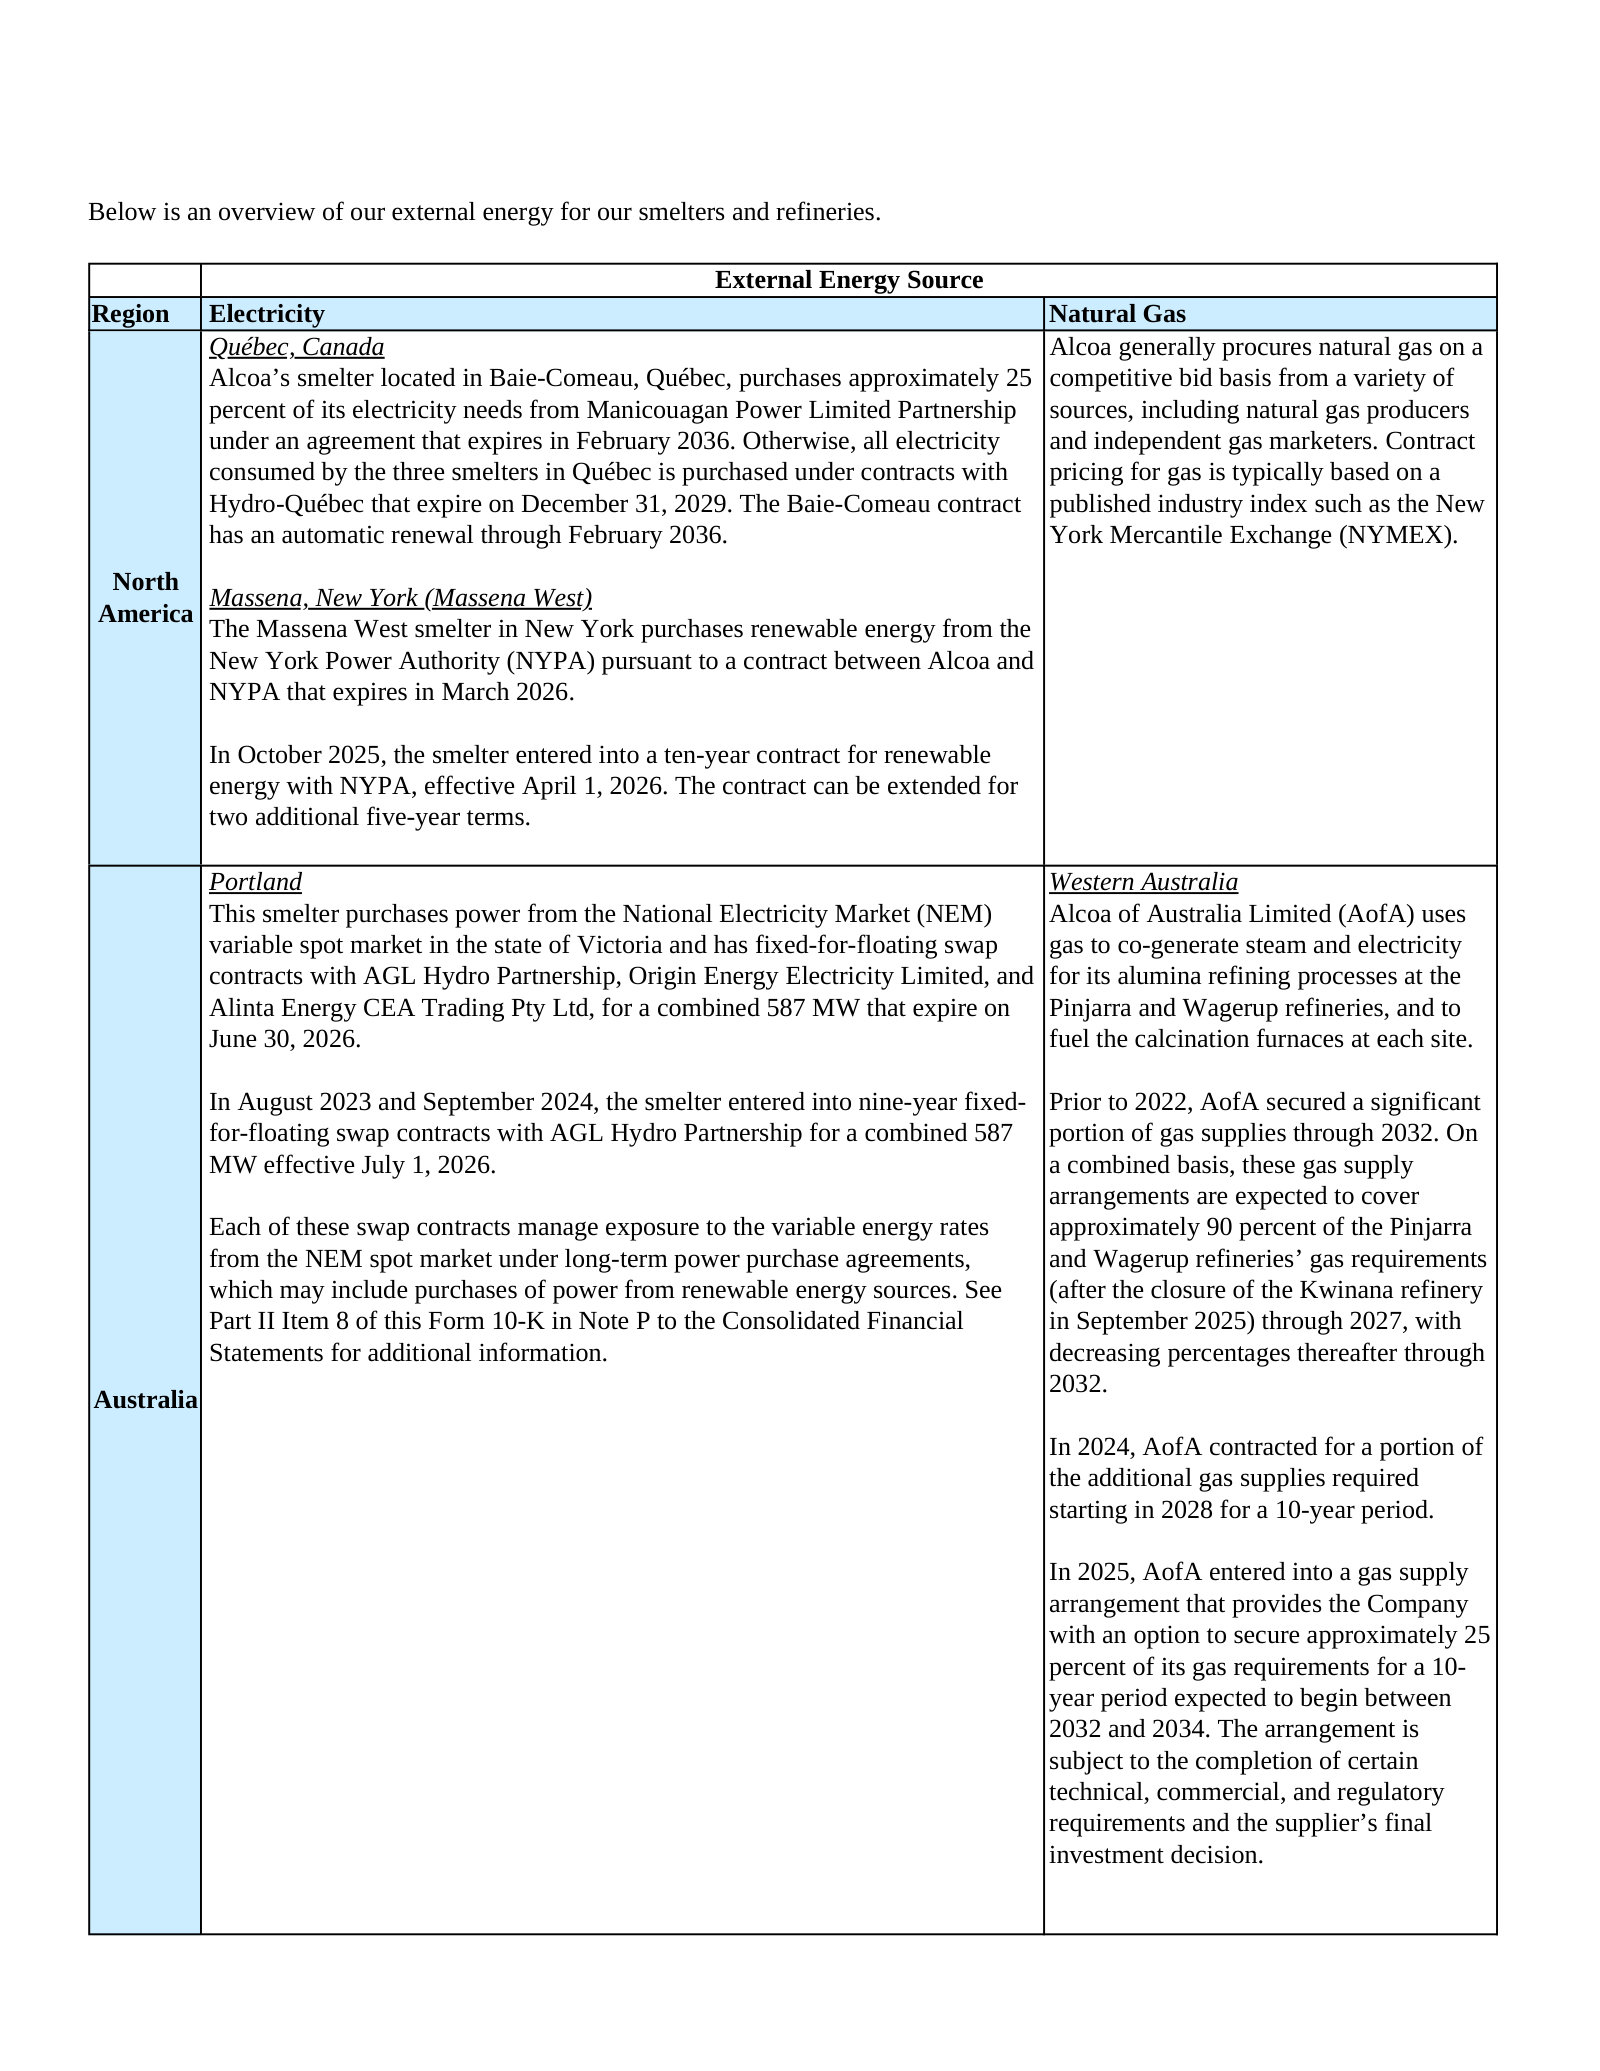
Energy Facilities and Sources — p. 10 · Read the full section →
Energy is roughly a quarter of both refining and smelting cost; this is where the contracts and expiry dates that fix that cost are set out.
Competition — p. 19 · Read the full section →
Alcoa's own placement on the cost curve, including the admission that lower Australian bauxite grades could cost it the first quartile.
We have in the past been and may in the future be unable to obtain, maintain, or renew permits or approvals necessary for our mining operations, which could materially adversely affect our operations and profitability. — p. 30 · Read the full section →
The most company-specific risk on the list: permitting delays have already forced Alcoa into lower-grade bauxite, raising refining costs.
Permitting risk stated as something that has already happened, not just a hypothetical.
Our mining operations are subject to extensive permitting and approval requirements. These include permits and approvals issued by various government agencies and regulatory bodies at the federal, state, and local levels of governments in the countries in which we operate. […] Failure to obtain, maintain, or renew permits or approvals, or permitting or approval delays, restrictions, or conditions has in the past and may in the future impact the quality of the bauxite we are able to mine and could increase our costs and affect our ability to efficiently and economically conduct our operations, potentially having a materially adverse impact on our results of operations and profitability.
p. 30 · Read in context →
Our operations and profitability have in the past and could in the future be impacted by rising energy costs and interruptions or uncertainty in energy supplies. — p. 32 · Read the full section →
The second risk that has already bitten: San Ciprián's losses and the Iberian power outage that paused the smelter restart.
San Ciprián as the worked example of energy-cost exposure; restart at ~65% of capacity, completion expected mid-2026.
Our refineries and smelters consume substantial amounts of natural gas and electricity in the production of alumina and aluminum. The prices for and availability of energy have in the past and could in the future be impacted by volatile market conditions resulting from factors beyond our control such as weather, political, regulatory, and economic conditions. For example, the San Ciprián refinery and smelter incurred substantial losses in 2025 and in prior years as a result of a challenging economic environment, primarily due to the high cost of energy. […] The restart of the San Ciprián smelter was paused in April 2025 following a widespread power outage across Spain and resumed in July 2025. The smelter was operating at approximately 65 percent of its total annual capacity of 228,000 metric tons as of December 31, 2025 and the Company expects that the restart will be completed by mid-2026.
p. 32 · Read in context →
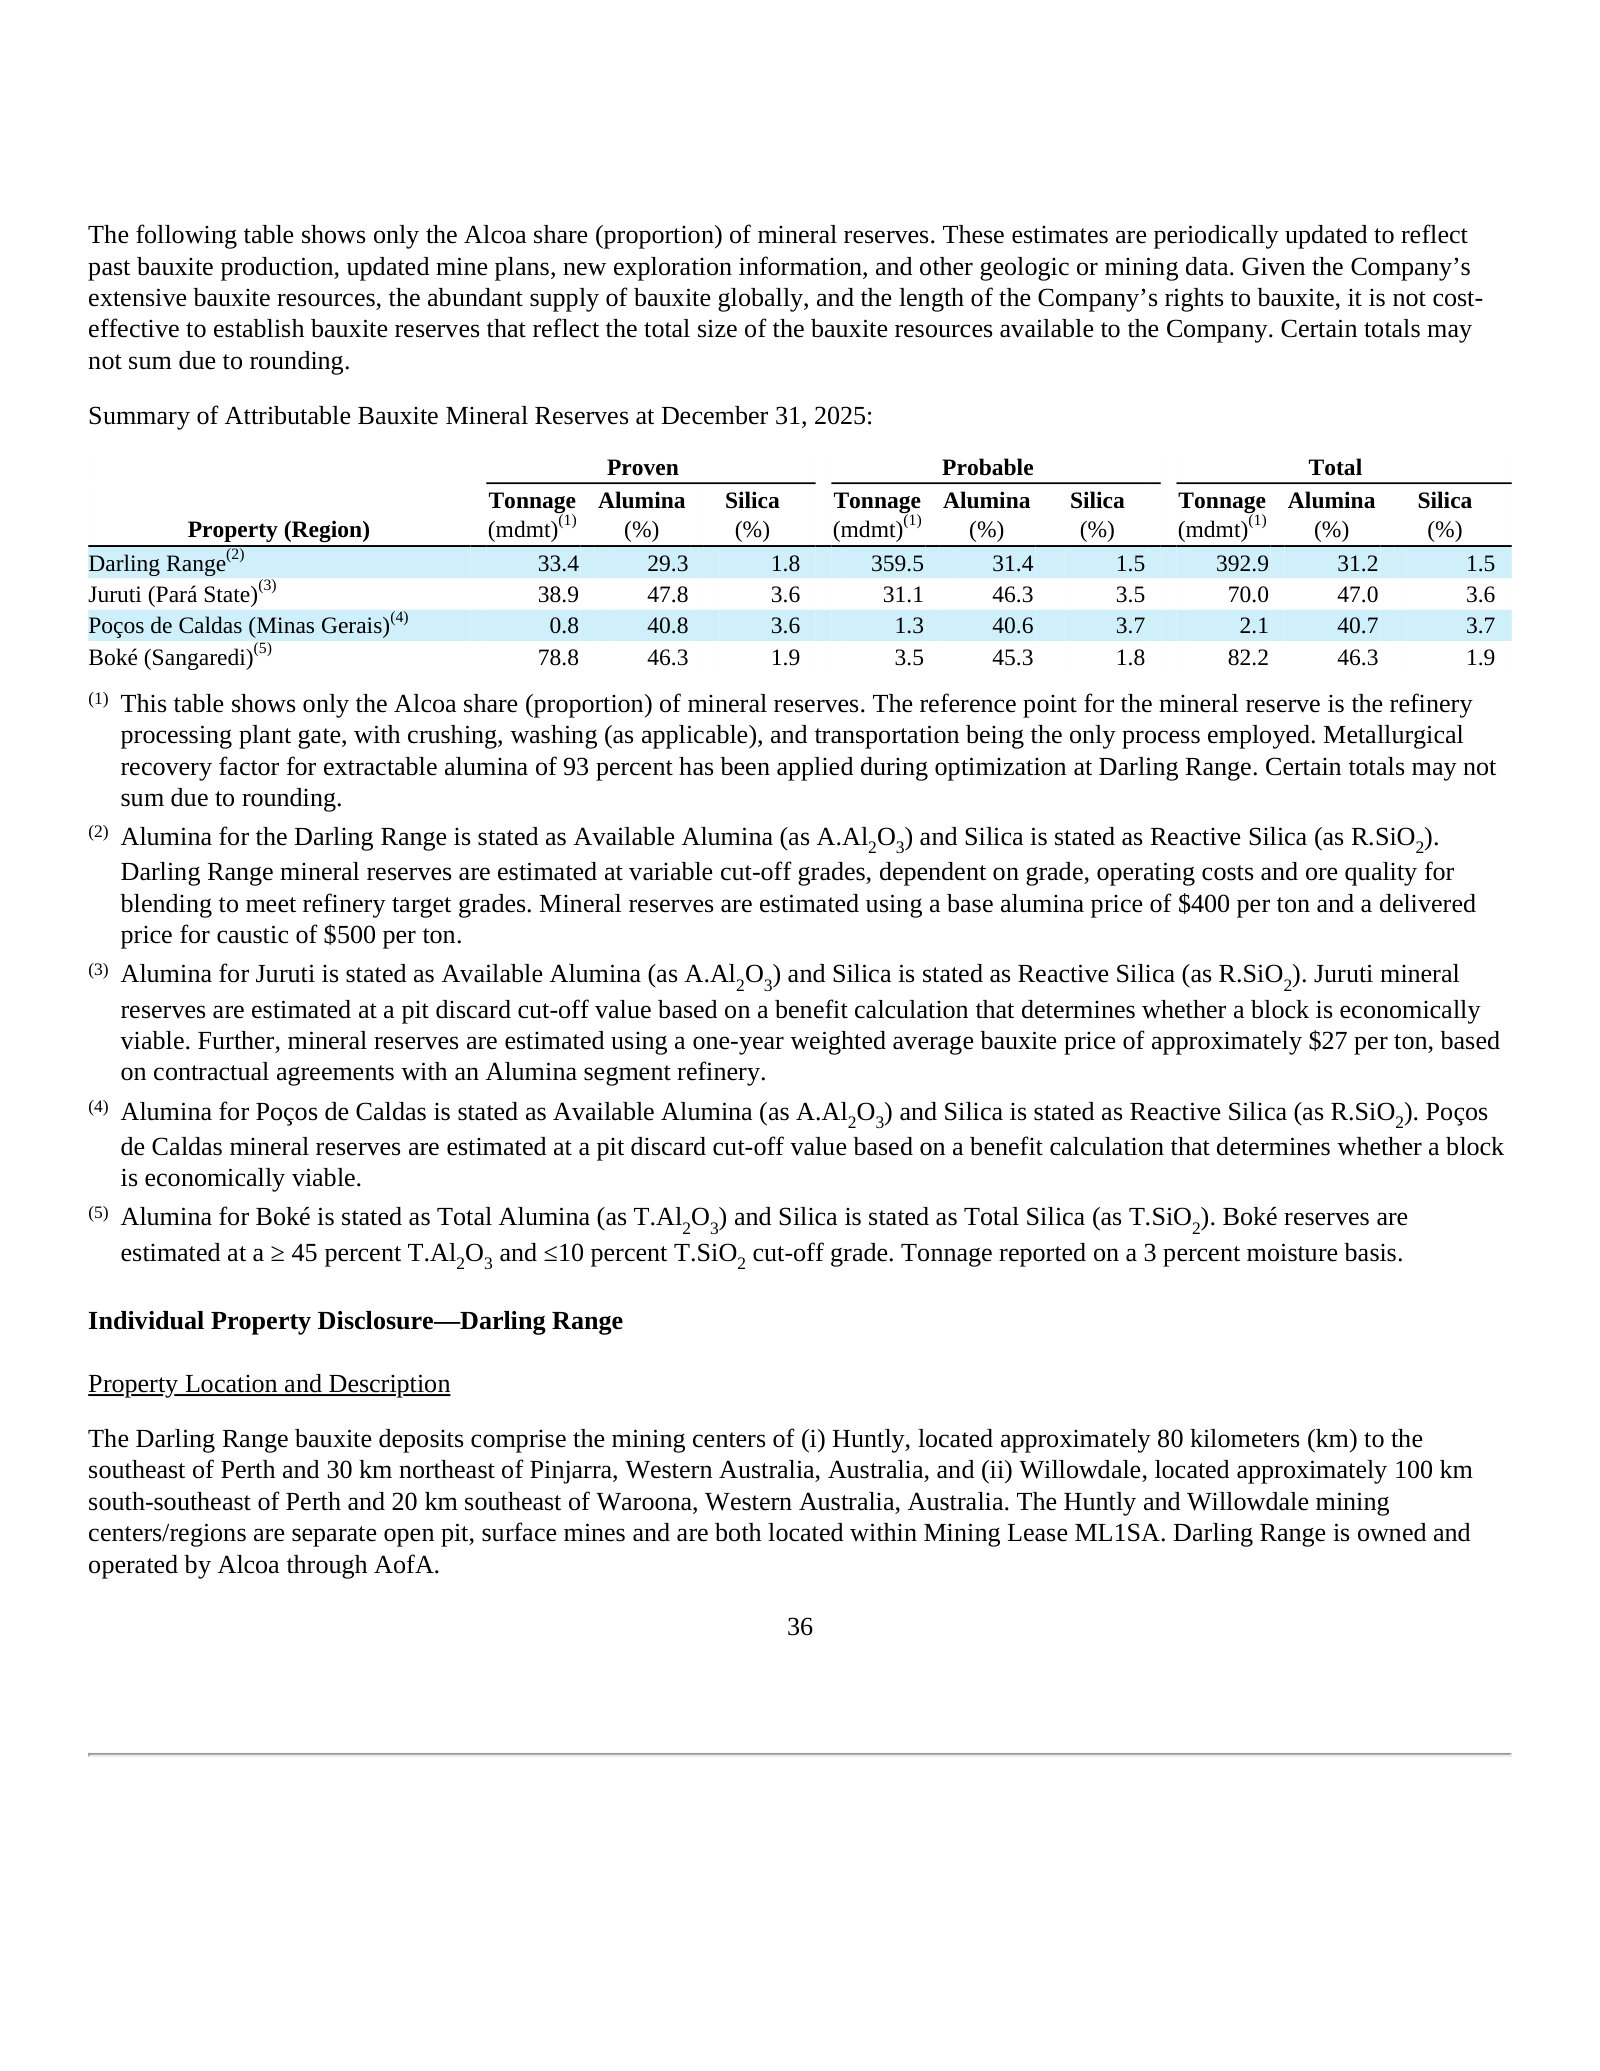
Bauxite Mineral Resources and Mineral Reserves — p. 59 · Read the full section →
The S-K 1300 reserve tables — grade and tonnage by mine — are the physical base under every refining cost assumption in the filing.
Item 7. Management's Discussion and Analysis — Overview and Business Update — p. 82 · Read the full section →
Management's own explanation of what moved 2025: alumina down 11%, aluminum up 9%, Midwest premium up 211% on Section 232 tariffs.
The 2025 price picture, including the tariff-driven Midwest premium and the offsetting cost moves.
During 2025, average alumina prices decreased by 11 percent and average aluminum prices increased 9 percent compared with 2024. After reaching an all-time high in the fourth quarter of 2024 primarily due to supply disruptions, alumina prices decreased largely in response to refinery expansions primarily in China and Indonesia. Aluminum prices were supported by strong market fundamentals and macroeconomic trends, including historically low inventory levels and rising demand. In addition, the average Midwest premium increased 211 percent year over year, largely reflecting U.S. Section 232 tariffs on aluminum imports from Canada, which increased from 25 percent on March 12, 2025 to 50 percent on June 4, 2025. […] At recent Midwest premium pricing, tariff costs on U.S. imports of aluminum from Canada are fully covered by the Midwest premium. Energy costs declined primarily due to higher pricing at the Brazil hydro-electric facilities and carbon dioxide compensation within the Aluminum segment, while raw material costs increased primarily due to higher caustic soda prices in the Alumina segment.
p. 82 · Read in context →
Alcoa Corporation — FY2022 Annual Report (Form 10-K) — FY2022
The last 10-K under the three-segment structure, with AWAC still 40% owned by Alumina Limited — the before picture for both changes. · Open the full document →
Item 1. Business — The Company — p. 3 · Read the full section →
The segment redefinition as it was announced: Bauxite and Alumina combined from January 2023, with AWAC still a joint venture.
Three reportable segments in 2022, combined into two from January 2023.
The Company’s operations in 2022 comprised three reportable business segments: Bauxite, Alumina, and Aluminum. The Bauxite and Alumina segments primarily consist of a series of affiliated operating entities held in Alcoa World Alumina and Chemicals, a global, unincorporated joint venture between Alcoa and Alumina Limited (described below). […] Beginning in January 2023, the Company changed its operating segments, by combining the Bauxite and Alumina segments, and will report its financial results in the following two segments: (i) Alumina and (ii) Aluminum.
p. 3 · Read in context →
More annual reports
Alcoa Corporation — FY2024 Annual Report (Form 10-K) — FY2024 · 240 pages · The year Alcoa acquired Alumina Limited and took full ownership of AWAC, and the year the Kwinana refinery was fully curtailed. · Open →
Alcoa Corporation — FY2023 Annual Report (Form 10-K) — FY2023 · 250 pages · First 10-K reported on the two-segment basis, and the year lower-grade Western Australian bauxite began raising refining costs. · Open →
Alcoa Corporation — FY2021 Annual Report (Form 10-K) — FY2021 · 211 pages · The peak-margin year of the cycle under the old three-segment structure, useful as the high-water mark for realized prices. · Open →
Source: S&P Capital IQ transcripts via Xpressfeed · latest indexed call 2026-07-16 · generated 2026-08-03.
Latest call digest
Alcoa Corporation, Q2 2026 Earnings Call, Jul 16, 2026 · 2026-07-16T21:00:00
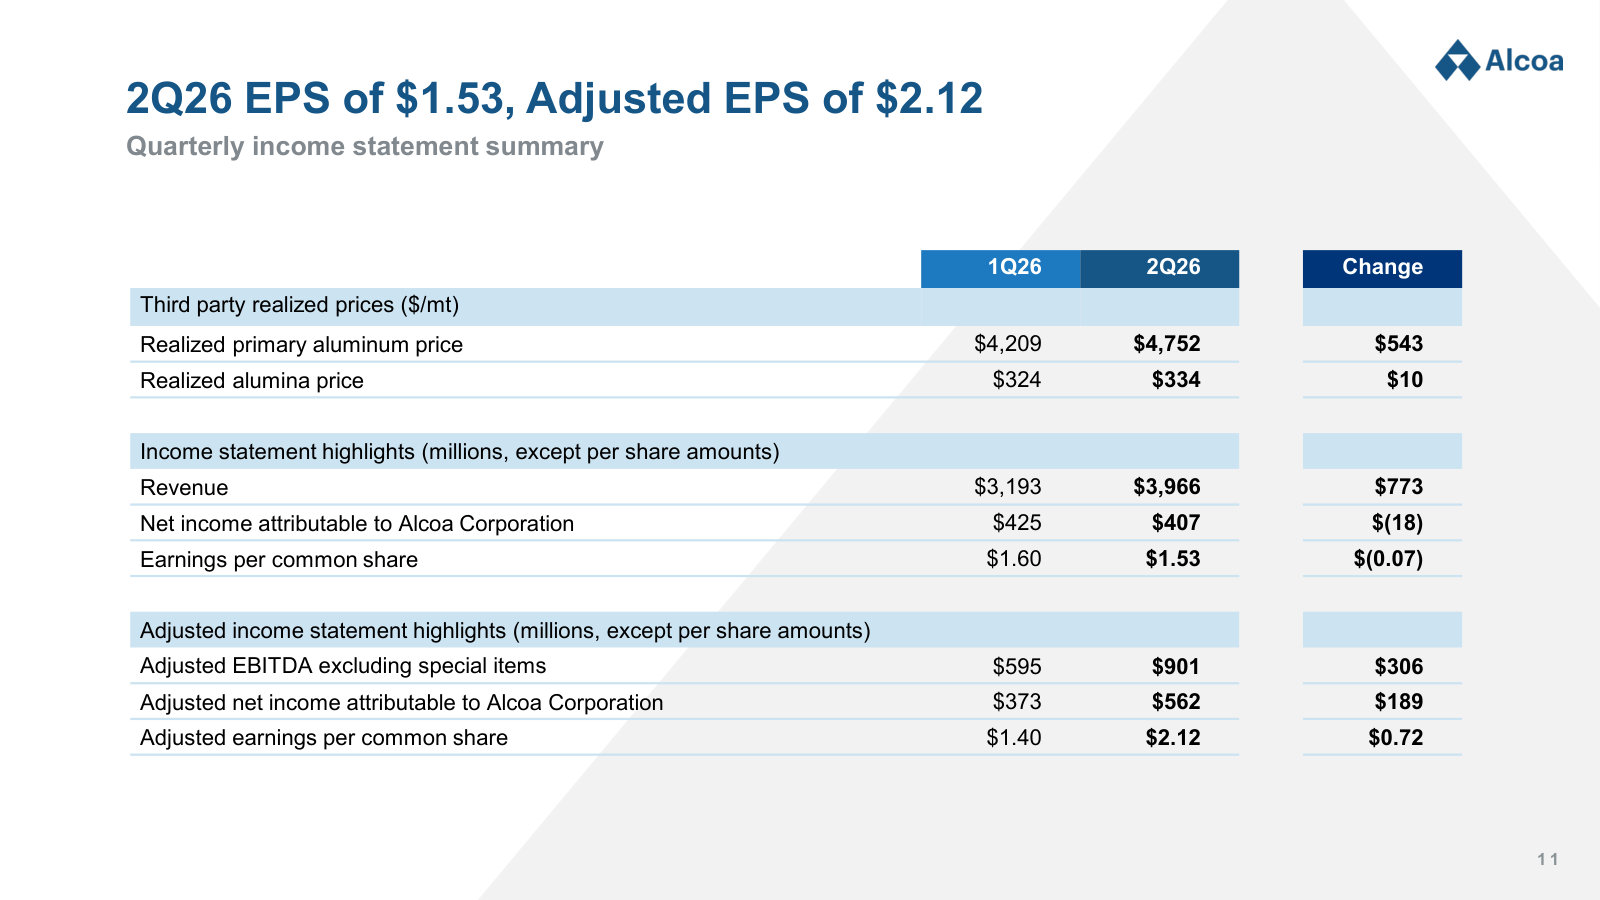
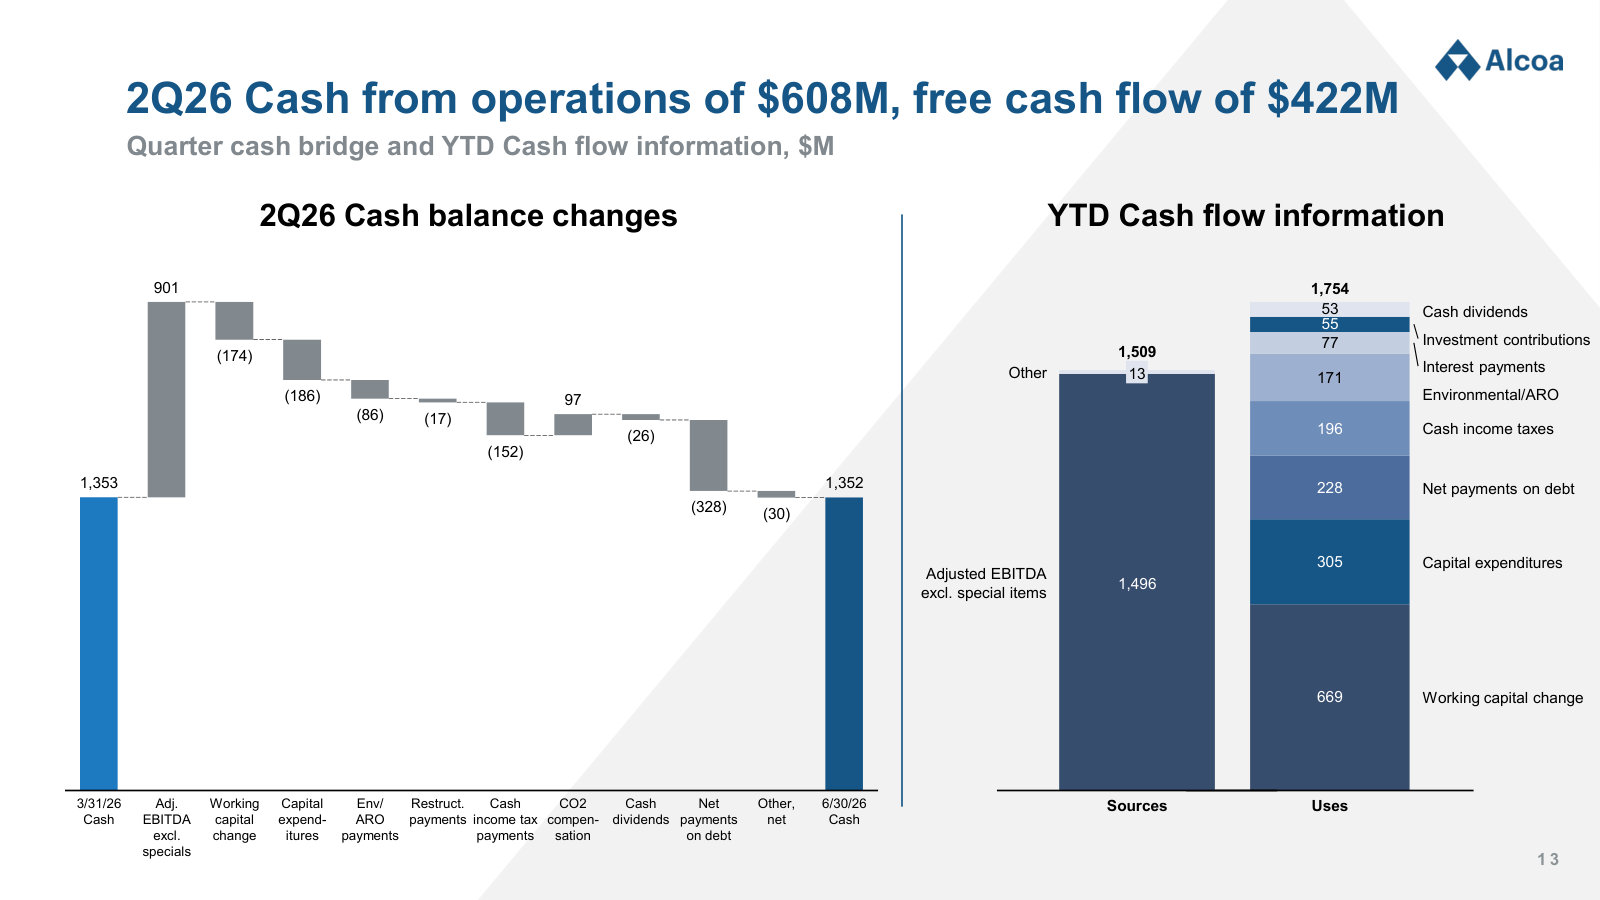
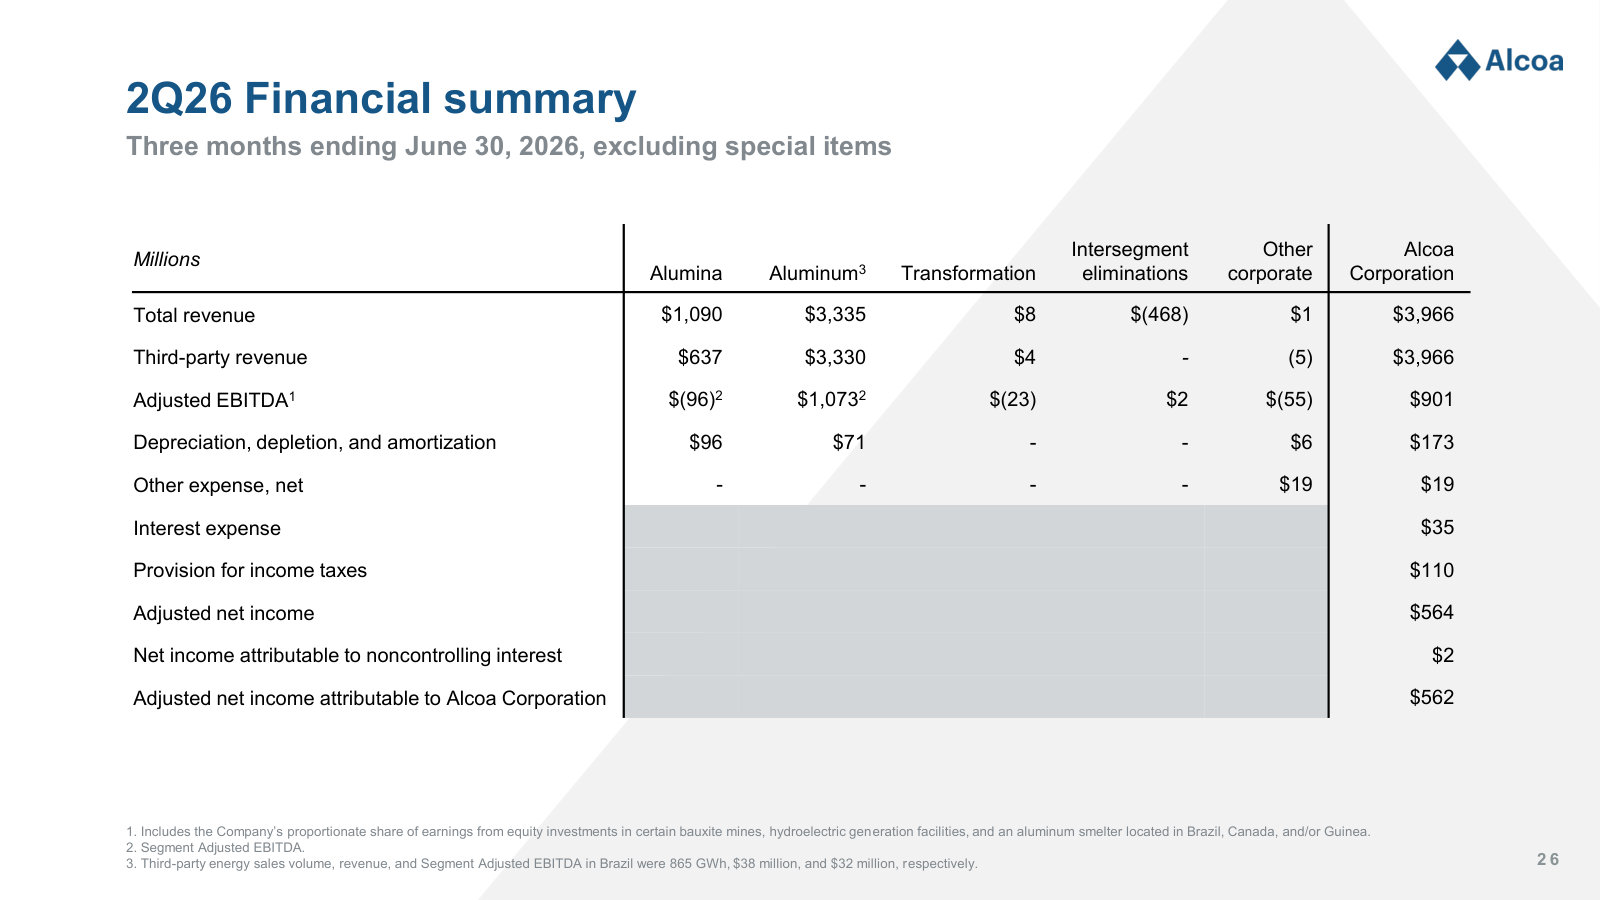
Q2 2026 call, July 16, 2026. Prepared remarks were built around the acquisition of South32's upstream aluminum assets, which management calls AliGroup, and around a record quarter: revenue up 24% to $4 billion, adjusted EBITDA of $901 million, and record Aluminum segment adjusted EBITDA of $1.1 billion at a 32.3% margin. Molly Beerman opened by getting ahead of the print, noting results were modestly below consensus because LME prices fell sharply in the final two weeks of June and the company's 15-day-lag sensitivities do not capture that.
Bill Oplinger spent an unusual amount of the script pre-answering deal questions "based on questions we have received from investors": the $3.1 billion cash and $1 billion equity mix, approximately $900 million of NPV synergies with roughly $50 million of run-rate savings in year one, a locked box estimated above $200 million at June 30, a 5% annualized ticking fee of roughly $80 million to $100 million, and a contingent value right capped at $750 million over four years. He also framed the cash consideration as sized so leverage does not exceed 2.0x. Analysts largely did not relitigate the deal; the only acquisition-adjacent question came from John Tumazos on the South African power contract that comes with the assets.
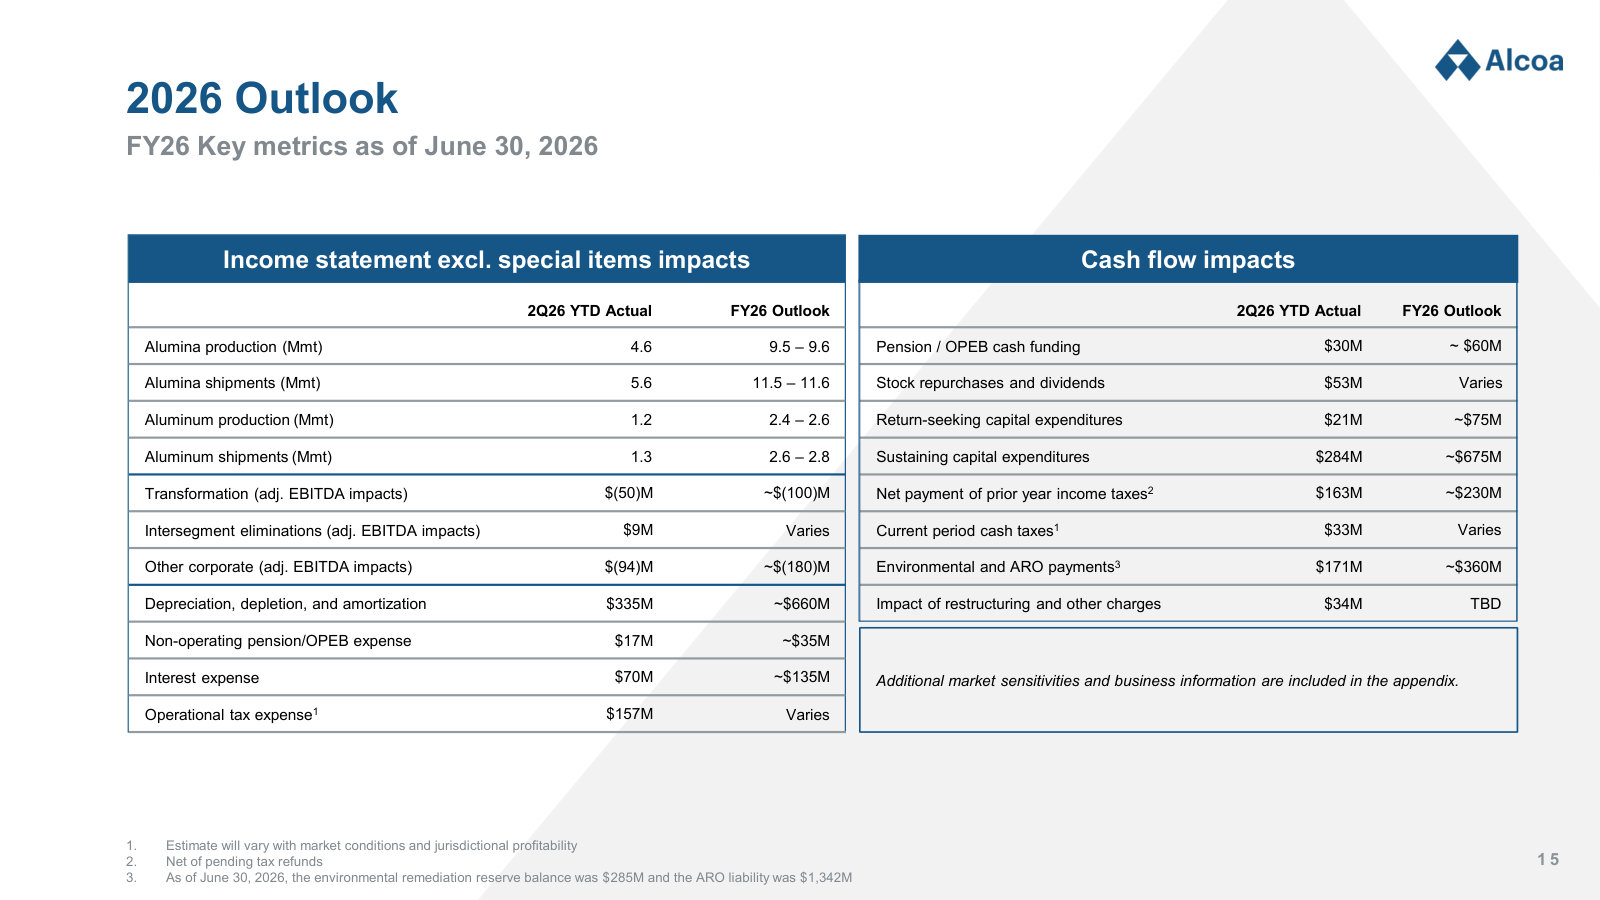
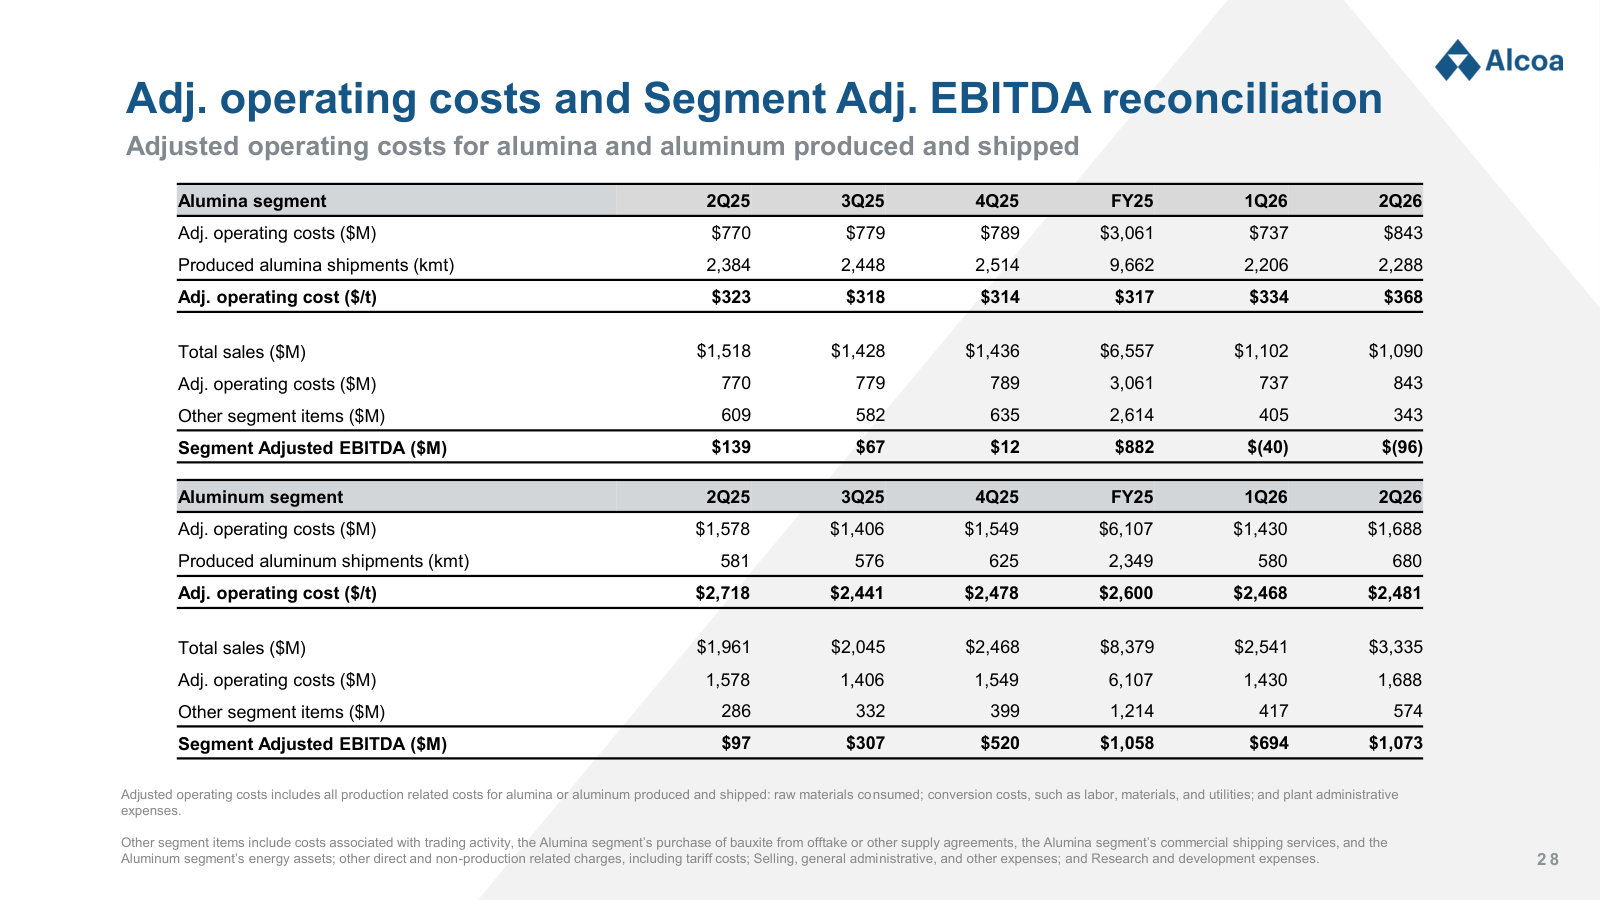
The Q&A instead went at the parts of the quarter that got worse. Full-year alumina production and shipment guidance was cut to 9.5-9.6 million and 11.5-11.6 million metric tons on Pinjarra instability, which Oplinger attributed to an oxalate outbreak compounded by a gas curtailment from Cyclone Narelle. Other corporate expense was raised to about $180 million and depreciation to about $660 million. The hardest exchange was Glyn Lawcock's on Western Australia: after five weeks in country, Oplinger said his confidence in securing the mining approvals is unchanged but the timing could extend beyond the year-end 2026 ministerial approval the company had committed to, with contingency built for a six-month delay and a secondary plan that would modify mining and refinery flow rates.
Guidance actually stated for Q3 2026: Alumina segment net favorable by about $10 million, Aluminum segment flat, Section 232 tariff costs down about $10 million, alumina costs in the Aluminum segment unfavorable by $10 million, and operational tax expense of $80 million to $90 million. Asset monetization remains at $500 million to $1 billion between now and 2030, with Massena East described as substantially negotiated but still unpapered.
Participant coverage from the latest call.
| Group | Participants | Count |
|---|---|---|
| Management | Operator; Louis Langlois — Senior Vice President of Treasury & Capital Markets, Alcoa Corporation; William Oplinger — President, CEO & Director, Alcoa Corporation; Molly Beerman — Executive VP & CFO, Alcoa Corporation | 4 |
| Analysts | Katja Jancic — Analyst, BMO Capital Markets Equity Research; Bennett Moore — Analyst, JPMorgan Chase & Co, Research Division; Henry Hearle — Analyst, B. Riley Securities, Inc., Research Division; Timna Tanners — Managing Director of Equity Analyst, Wells Fargo Securities, LLC, Research Division; Glyn Lawcock — Head of Resources and Mining Research, Barrenjoey Markets Pty Limited, Research Division; Christopher LaFemina — Senior Equity Research Analyst, Jefferies LLC, Research Division; Carlos de Alba — Equity Analyst, Morgan Stanley, Research Division; Lawson Winder — VP & Research Analyst, BofA Securities, Research Division; John Tumazos — President & Chief Executive Officer, John Tumazos Very Independent Research, LLC | 9 |
Curated latest-call exchanges; one row per analyst topic.
| Analyst | Firm | Topic | What changed in Q&A |
|---|---|---|---|
| Glyn Lawcock | Barrenjoey | Western Australia mine approvals | Asked whether anything needed calling out after Oplinger's five weeks in Australia. The answer conceded that timing could extend past the previously committed year-end ministerial approval, while holding confidence in the eventual outcome. Contingency is six months with no supply, quality or cost impact; beyond that, modified mining and refinery flow rates to avoid an ore gap. |
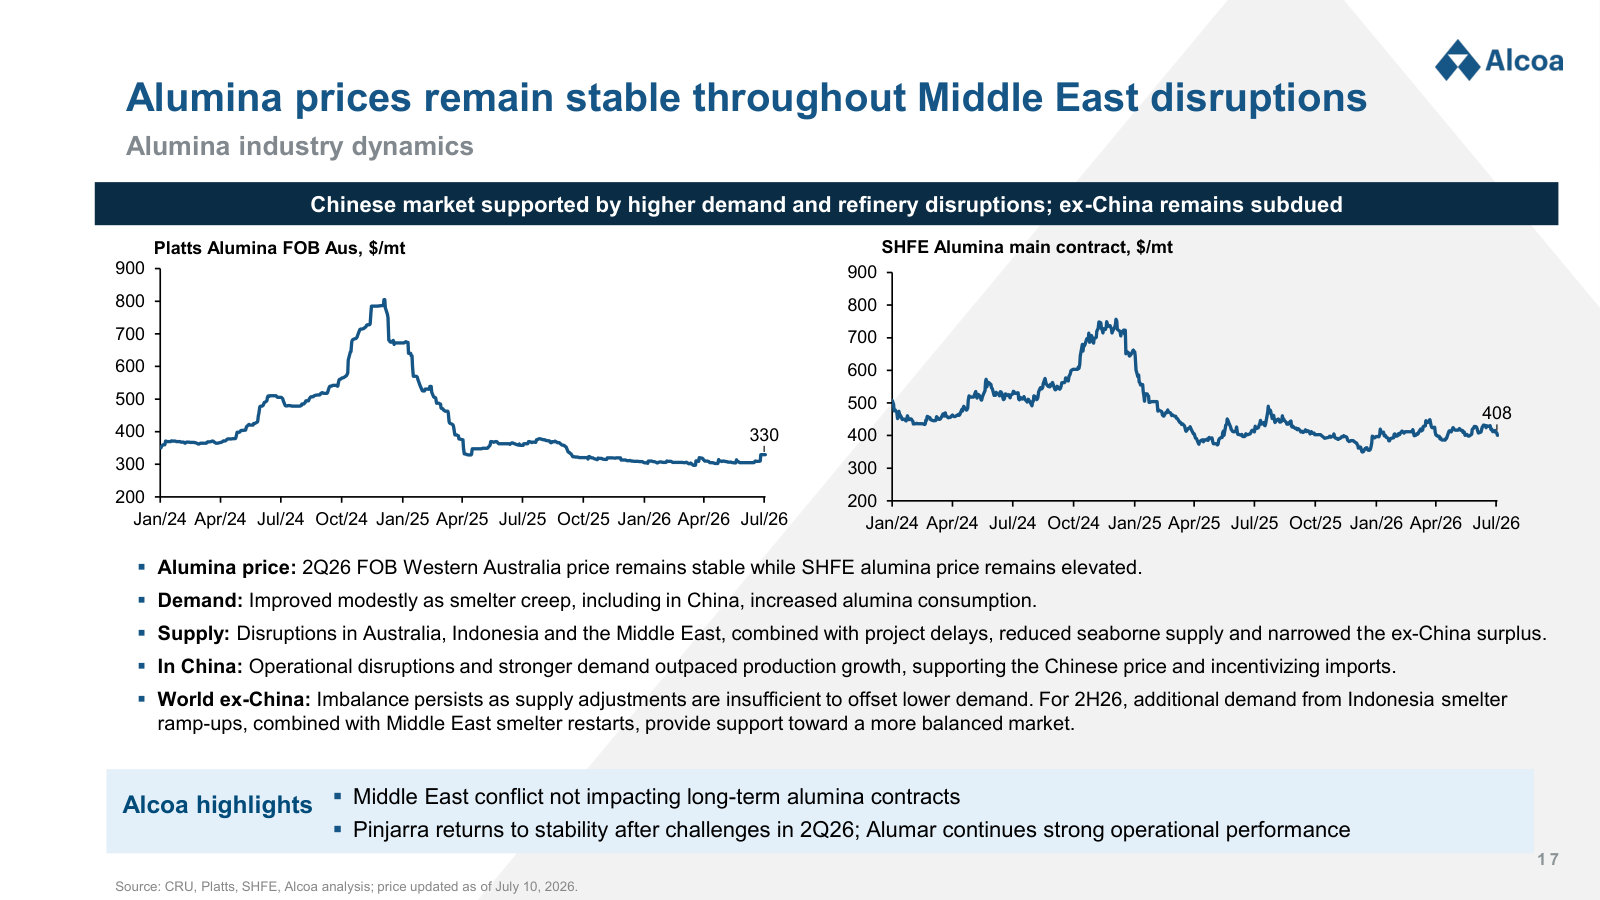
| Timna Tanners | Wells Fargo | Aluminum price retreat and Chinese output | Pressed on why LME returned to pre-conflict levels despite the company's own emphasis on Middle East disruption. Oplinger attributed it to sentiment rather than changed fundamentals, and separately disclosed that China is now projected to run 45-46 million metric tons, above the 45 million cap, which he characterised as creep rather than a policy change. |
| Christopher LaFemina | Jefferies | Depreciation guidance and asset lives | Asked which mines drove the higher depreciation charge and why the assumptions changed. Beerman said it relates to lives of certain assets and pre-mining accretion rather than shorter mine life, and did not name the assets or the second driver. |
| Carlos de Alba | Morgan Stanley | Alumina segment sequential bridge | Worked through the gap between the Q2 guide and the Q3 guide. Beerman confirmed the full $30 million Pinjarra recovery is in the Q3 net favorable $10 million, offset by planned maintenance at the Alumar refinery and Juruti mine. |
| Henry Hearle | B. Riley Securities | Massena East sale and Pinjarra cause | Asked whether New York's newly announced data center moratorium affects the Massena East transaction. Management said it is still assessing the executive order without a complete view but is moving forward. Also drew out that Pinjarra was an oxalate outbreak compounded by a gas-driven curtailment, not bauxite grade. |
| Lawson Winder | BofA Securities | U.S. demand and San Ciprian economics | Probed whether U.S. softness is destocking or real demand destruction; Oplinger said conditions are strong and hard to separate from customers backfilling Middle East supply, while flagging softness in building and construction. On San Ciprian, Beerman said the smelter's EBITDA fully covered refinery losses in the quarter but the site as a whole still consumes cash. |
| Glyn Lawcock | Barrenjoey | Carbon and caustic input costs | Pushed twice on whether carbon costs become a Q4 tailwind. Beerman said carbon purchase prices are holding steady at the higher rate and declined to call a reversal, then volunteered that caustic has already corrected and will flow through on a roughly six-month lag. |
| Bennett Moore | JPMorgan | Value-add capacity and restart trajectory | Asked how much more casting capacity can be flexed. Oplinger put Europe and North America at roughly 95% full, then walked the order book region by region, and pointed to Alumar at about 95% restarted plus small remaining headroom at Portland as the Q3 volume sources. |
| John Tumazos | John Tumazos Very Independent Research | South African power contract renewal | The only question touching the acquisition, asking about the smelter power contract renewal roughly five years out. Oplinger declined to speculate on an unclosed transaction, described South African market reforms favourably, and noted South32 has already begun discussions with Eskom. |
Theme tracker
Themes are curator-classified across supplied calls.
| Theme | Status | Quarters mentioned | Read-through |
|---|---|---|---|
| Western Australia mine approvals | persisted | Q3 2023, Q4 2023, Q1 2024, Q3 2024, Q1 2025, Q2 2025, Q3 2025, Q4 2025, Q1 2026, Q2 2026 | The single most durable open item in the file, and the timeline has moved in one direction. Ministerial approval was targeted for early 2026 in Q3 2024, declared no longer feasible in Q2 2025, reset to year-end 2026 from Q3 2025 through Q1 2026, and in Q2 2026 described as possibly extending beyond that. Entry into the new mine regions slipped from late 2027 to 2028 along the way. Management has consistently separated confidence in the outcome from confidence in the date. |
| San Ciprian complex | persisted | Q3 2023, Q4 2023, Q1 2024, Q2 2024, Q3 2024, Q4 2024, Q1 2025, Q2 2025, Q3 2025, Q4 2025, Q1 2026, Q2 2026 | Present in all twelve calls and the clearest example of a commitment actually landing. The arc runs from a failed sale process and near-insolvency talk, through the IGNIS EQT joint venture and the viability agreement, to a smelter restart completed April 7, 2026. The refinery is the residual problem: as of Q2 2026 the smelter's EBITDA covers refinery losses but the site still consumes cash, and the cash-neutrality target remains 2027. |
| U.S. Section 232 tariffs and the Midwest premium | persisted | Q4 2024, Q1 2025, Q2 2025, Q3 2025, Q4 2025, Q1 2026, Q2 2026 | Absent from the 2023 and mid-2024 calls, then the dominant subject for four straight quarters. The story resolved rather than ended: the Midwest premium initially lagged the tariff, Alcoa redirected Canadian metal, and by Q3 2025 management said the premium covers the full tariff cost and Canadian flows returned to normal. Attention has fallen off sharply since, and Q2 2026 discussion was limited to a roughly $10 million volume-driven decrease in tariff cost. |
| Idle-site monetization and data centers | persisted | Q4 2024, Q1 2025, Q2 2025, Q3 2025, Q4 2025, Q1 2026, Q2 2026 | Emerged as a real agenda item in Q4 2024 and has been raised in every call since without closing. The $500 million to $1 billion target across ten priority sites has held; the timing has not, moving from expected agreement in the first half of 2026 to substantially negotiated but still being papered in Q2 2026. A newly announced New York data center moratorium is now an additional variable on the lead site. |
| Alumar smelter stabilization | persisted | Q3 2023, Q4 2023, Q1 2024, Q2 2024, Q3 2024, Q4 2024, Q1 2025, Q2 2025, Q3 2025, Q4 2025, Q1 2026, Q2 2026 | A three-year ramp that management has repeatedly said would finish sooner than it did: roughly 65% of capacity in Q3 2023, near 80% in Q3 2024, 91-92% through 2025, a power-interruption setback in Q4 2025, and about 95% by Q2 2026. Worth tracking because it is the longest-running example of restart guidance being optimistic. |
| Warrick fourth potline restart | persisted | Q4 2023, Q1 2024, Q2 2024, Q4 2024, Q1 2025, Q2 2025, Q3 2025, Q4 2025, Q1 2026 | Asked once in essentially every recent call and answered the same way each time: roughly $100 million and one to two years, gated on long-lead electrical equipment and long-term power rather than on price. Management has been explicit that it will not commit capital on the strength of a tariff. In Q4 2025 Oplinger went further and called a restart unlikely; in Q2 2026 an analyst set Warrick aside when asking about restarts. |
| Deleveraging versus shareholder returns | persisted | Q3 2024, Q4 2024, Q1 2025, Q2 2025, Q3 2025, Q4 2025, Q1 2026, Q2 2026 | Analysts have asked about buybacks every quarter since the net debt target was published, and the answer was consistently balance sheet first. Adjusted net debt reached the $1.5 billion top of range at year-end 2025 and the 2028 notes were redeemed in May 2026. The AliGroup structure changes the frame: management is now sizing cash consideration against a 2.0x leverage ceiling rather than the $1 billion to $1.5 billion net debt range. |
| Middle East conflict and supply chain disruption | emerged | Q1 2026, Q2 2026 | Absent before 2026 and then the organizing theme of the Q1 2026 call, with the Strait of Hormuz closure taking refining and smelting capacity offline and lifting freight, diesel and coke costs. By Q2 2026 it has become a commercial tailwind rather than only a risk: customers in North America and Europe are backfilling Middle East supply, driving value-add premiums and a stronger order book. |
| Upstream M&A: the AliGroup acquisition | emerged | Q2 2026 | New this quarter and by management's description the largest transaction in Alcoa Corporation's history, adding roughly 5.2 million metric tons of alumina and about 900,000 metric tons of primary aluminum capacity. The groundwork is visible earlier: in Q3 2025 Oplinger said the company would look at M&A across the product line where it could create synergies not otherwise available to shareholders. |
| Gallium at Wagerup | emerged | Q3 2025, Q4 2025, Q1 2026, Q2 2026 | From a Japanese joint development agreement to three-government backing in Q3 2025, to final investment decision in July 2026 with Alcoa contributing $24 million and expecting no further contribution. Economically small by design; management has been consistent that the value is strategic positioning of the Australian refining assets rather than gallium earnings. |
| CBAM as a 2026 earnings driver | dropped | Q3 2024, Q3 2025, Q4 2025 | Discussed across three calls and quantified in detail in Q4 2025, where management estimated a net positive of roughly $10 per metric ton in 2026 and said it would reconfirm as actual dynamics materialize. Neither the Q1 2026 nor the Q2 2026 call returns to it. Given the size of the estimate the silence is more likely immateriality than concealment, but the promised reconfirmation has not happened. |
| The $645 million profitability improvement program | dropped | Q1 2024, Q2 2024, Q3 2024, Q4 2024, Q1 2025 | Tracked bucket by bucket for five quarters, then absent from Q2 2025 onward. The disappearance is explained rather than evasive: the target was exceeded at $675 million by year-end 2024, and Beerman said the remaining initiatives were folded into the 2025 operating plan because standalone programs are hard to hold accountable internally. The practical consequence is that there is no longer an external scorecard for cost delivery. |
Guidance ledger
Quotes, calls, and speakers are source-verified; outcomes are curator-classified.
| Verbatim guidance | Call | Speaker | Curator outcome | Outcome note |
|---|---|---|---|---|
| “we are focused on receiving ministerial approval by early 2026” | Alcoa Corporation, Q3 2024 Earnings Call, Oct 16, 2024 · 2024-10-16T21:00:00 | William Oplinger | missed | In Q2 2025 management said the original timeline was no longer feasible and that approval would extend beyond the first quarter of 2026. The target was reset to year-end 2026, and in Q2 2026 was described as possibly extending beyond that. |
| “The Aluminum segment is expected to produce 2.3 million to 2.5 million tonnes, increasing on smelter restarts, while shipments are expected to range between 2.6 million and 2.8 million tonnes.” | Alcoa Corporation, Q4 2024 Earnings Call, Jan 22, 2025 · 2025-01-22T22:00:00 | Molly Beerman | missed | Cut in Q2 2025 to 2.5 million to 2.6 million metric tons of shipments, which management attributed to the San Ciprian restart being disrupted by the April nationwide power outage in Spain. |
| “The expectation that we would be into the new mine areas in late 2027 has now slipped out into 2028.” | Alcoa Corporation, Q2 2025 Earnings Call, Jul 16, 2025 · 2025-07-16T21:00:00 | William Oplinger | pending | Tied to the approvals timeline. Management has said contingency plans cover a delay of up to 15 months with no cost impact in 2025 or 2026; the Q2 2026 call restated contingency as six months clean, then modified mining and refinery flow rates beyond that. |
| “We are pushing to have first metal by the end of 2026.” | Alcoa Corporation, Q3 2025 Earnings Call, Oct 22, 2025 · 2025-10-22T21:00:00 | William Oplinger | pending | Said at the time to be an aggressive schedule. Final investment decision on the gallium facility was only announced in July 2026, per the Q2 2026 call, which leaves little of the year to reach first metal. |
| “we expect alumina production to range between 9.7 million and 9.9 million tons and shipments to range between 11.8 million and 12.0 million tons” | Alcoa Corporation, Q4 2025 Earnings Call, Jan 22, 2026 · 2026-01-22T22:00:00 | Molly Beerman | missed | Lowered in Q2 2026 to 9.5-9.6 million metric tons of production and 11.5-11.6 million of shipments, attributed to Pinjarra instability and a gas-driven curtailment. Management said the lost volume will not be fully recovered. |
| “We continue to expect that the restart will be completed in the first half of 2026 as previously communicated.” | Alcoa Corporation, Q4 2025 Earnings Call, Jan 22, 2026 · 2026-01-22T22:00:00 | William Oplinger | kept | The Q1 2026 call reported the San Ciprian smelter restart safely completed on April 7, 2026, and Q2 2026 described the ramp as on time and on budget. |
| “we expect CBAM to generate a net positive impact of approximately $10 per metric ton in 2026” | Alcoa Corporation, Q4 2025 Earnings Call, Jan 22, 2026 · 2026-01-22T22:00:00 | William Oplinger | unknown | Management said it would reconfirm the estimate as actual CBAM dynamics materialize. Neither of the two subsequent calls in the supplied history revisits it. |
| “we have an EBITDA loss of approximately $75 million to $100 million” | Alcoa Corporation, Q4 2025 Earnings Call, Jan 22, 2026 · 2026-01-22T22:00:00 | Molly Beerman | pending | The 2026 guide for the combined San Ciprian smelter and refinery, alongside free cash flow consumption of roughly $100 million to $130 million. Q2 2026 reported the smelter covering refinery losses on EBITDA, with the site still consuming cash; no full-year update was given. |
| “We continue to anticipate ministerial approvals by year-end 2026, consistent with the time line we've previously shared.” | Alcoa Corporation, Q1 2026 Earnings Call, Apr 16, 2026 · 2026-04-16T21:00:00 | William Oplinger | pending | One quarter later, Oplinger said timing could extend beyond the original expectation while leaving his confidence in the eventual outcome unchanged. The date has not formally been withdrawn. |
| “We have identified approximately $900 million of net present value synergies, including roughly $50 million of run rate cost savings starting in the first year following closing.” | Alcoa Corporation, Q2 2026 Earnings Call, Jul 16, 2026 · 2026-07-16T21:00:00 | William Oplinger | pending | The transaction has not closed. South32 shareholder approval is expected in October or November, after which a 5% annualized ticking fee begins accruing on the $3.1 billion cash consideration. |
Q&A pressure map
Question counts and firms are curator tallies; analyst coverage shown above.
| Topic | Questions | Firms | Pressure / response |
|---|---|---|---|
| U.S. Section 232 tariffs and the Midwest premium | 29 | Wolfe Research, Wells Fargo, BMO Capital Markets, JPMorgan, Jefferies, Citigroup, UBS, B. Riley Securities, Barrenjoey, Vertical Research Partners | Counted across the last eight calls, including follow-ups. The heaviest concentration was Q1 and Q2 2025, when analysts repeatedly worked the arithmetic of tariff cost against premium recapture. LaFemina pushed the sharpest version, arguing tariffs should be a wash in equilibrium; management agreed on the theory but Beerman countered that 70% of Canadian metal is on contract and cannot be moved freely. Pressure has since fallen away as the premium caught up. |
| San Ciprian viability and cash burn | 20 | Jefferies, JPMorgan, Morgan Stanley, UBS, BMO Capital Markets, BofA Securities, B. Riley Securities | Asked in every one of the last eight calls. Analysts pressed hardest in late 2024 on downside scenarios, including whether the entity would enter insolvency; management gave closure cost ranges while declining to treat closure as the plan. Questions have since narrowed to whether the smelter covers refinery losses, which is a fair measure of how far the situation has moved. |
| Alumar and smelter restart execution | 17 | BMO Capital Markets, Morgan Stanley, UBS, Jefferies, JPMorgan, B. Riley Securities, Wolfe Research, John Tumazos Very Independent Research | Recurring because the answer kept changing. Nick Giles put the accumulated scepticism directly in Q4 2025, asking what gives confidence 2026 is attainable after 2025 production and shipments came in below initial guidance. Oplinger's Q2 2025 answer is the most candid of the file, acknowledging he had missed the same target before. |
| Idle-site monetization and data center interest | 11 | Morgan Stanley, B. Riley Securities, UBS, BMO Capital Markets, BofA Securities, John Tumazos Very Independent Research | Analysts have repeatedly tried to attach a number or a date to the $500 million to $1 billion target and have not gotten one. In Q4 2025 Daniel Major asked how much of the range the lead site represents; Beerman explicitly declined until the deal closes. That is a stated refusal rather than an evasion, but it has now persisted across seven calls. |
| Western Australia mine approvals | 10 | Barrenjoey, BMO Capital Markets, JPMorgan, Morgan Stanley, UBS, BofA Securities | Glyn Lawcock has raised it most persistently, generally asking for red flags rather than for a date. Answers have been detailed on process, including roughly 60,000 public comments and the specific concerns around water proximity and jarrah forest rehabilitation, and have been forthcoming about slippage when it happened. |
| Capital allocation, net debt and shareholder returns | 9 | BMO Capital Markets, BofA Securities, Jefferies, Barrenjoey, Wells Fargo, Wolfe Research, B. Riley Securities, UBS | A standing question since Q3 2024 that has never produced a buyback commitment. The answer has been consistent to the point of formula: fund operations, hold a strong balance sheet, then balance returns against growth. The AliGroup announcement resolves the question in favour of growth without the debate ever being had on a call. |
| Warrick fourth potline restart | 7 | Wolfe Research, Wells Fargo, B. Riley Securities, JPMorgan | Asked once in each of the last seven calls, from four firms, and answered with the same $100 million and one-to-two-year framing every time. The consistency itself is the signal: analysts keep testing whether high prices or tariffs change the maths, and management keeps saying capital will not follow a policy that can be reversed. |
| Depreciation and asset life assumptions | 1 | Jefferies | Included because the answer plainly did not address the question. LaFemina asked which mines drove the higher depreciation guidance and why the assumptions changed; Beerman said it relates to lives of certain assets and pre-mining accretion rather than mine life, and said the second driver was escaping her. No follow-up was taken, so the increase in guided full-year depreciation to approximately $660 million went unexplained on the call. |
Language shifts
Only language evidence verified against the referenced component is shown.
| Observation | Verbatim evidence | Call ID | Component |
|---|---|---|---|
| The approvals language moved from flat assertion to a split between outcome and timing. One quarter earlier the timeline was described as unchanged and consistent with prior guidance; here Oplinger explicitly separates his confidence in getting the approval from his confidence in when. | “while my confidence in the outcome remains unchanged, the timing could extend beyond our original expectations” | 2006225987 | 36 |
| For comparison, the Q1 2026 formulation carried no such hedge and anchored explicitly to the previously communicated date. | “We continue to anticipate ministerial approvals by year-end 2026, consistent with the time line we've previously shared.” | 1990238754 | 2 |
| New in Q2 2026: the CFO addresses a consensus miss inside prepared remarks rather than waiting for the question, and pre-emptively flags a limitation in the company's own published sensitivities. That is a change in disclosure posture, not just in tone. | “While our reported results were modestly below consensus, the variance was driven by lower-than-expected aluminum price realization late in the quarter as LME prices declined sharply in the final 2 weeks of June.” | 2006225987 | 3 |
| The balance sheet framing changed. Two quarters earlier the stated goal was not merely to reach the $1 billion to $1.5 billion adjusted net debt range but to stay inside it through the cycle; the acquisition is now sized against a leverage ceiling instead. | “we set the cash consideration to a level that allows us to limit debt and not exceed a leverage ratio of 2.0x based on recent pricing” | 2006225987 | 2 |
| The prior commitment, for contrast, was framed as a through-cycle discipline rather than a one-time target. | “our goal is not only to reach this range but to remain within it through the cycles” | 1974724310 | 3 |
| Order book language has strengthened materially. In Q3 2025 it was characterised as stable with a stated exception; in Q2 2026 it is a year-over-year comparison with no carve-outs, which is the most confident commercial framing in the twelve-call history. | “our 2026 order book is stronger than it was at this time last year across all major regions and product categories” | 2006225987 | 4 |
| The clearest instance of caution rather than confidence in the file, and a useful benchmark for how this management describes its own reliability when a target has slipped repeatedly. | “that's my target, but I've missed my target before. So take that with a grain of salt.” | 1949687379 | 53 |
Twelve calls show a management team that has largely delivered on the things it controls directly, including the San Ciprian restart, cost programs and record smelter production, while repeatedly missing dates that depend on regulators, ramps and refinery reliability. That distinction matters more now than it did: the AliGroup acquisition puts the company's largest-ever integration on top of an unresolved Australian approvals process and a refining business that just cut full-year guidance.
Competitors describe Alcoa Corporation's market in their own filings and calls. These verified passages and visual pages show where their strategies meet, using source documents preserved in Sources.
Century Aluminum Company (CENX)
The head-to-head competitor in Alcoa's home market: a US-listed pure-play primary aluminum producer that, like Alcoa, also owns an upstream bauxite-and-alumina position (55% of Jamalco in Jamaica). Century claims to smelt the majority of America's primary aluminum, is the loudest corporate advocate of the Section 232 tariff regime that reprices Alcoa's Canadian metal, and is building — with Emirates Global Aluminium — the first new US smelter in nearly 50 years, a project sized to reset the domestic supply balance Alcoa sells into.
Century's own share claim in the market Alcoa's US smelters sell into — described by management as smelting nearly 60% of American primary aluminum — together with the Oklahoma joint venture with Emirates Global Aluminium. The 750,000-tonne figure and the "more than double total U.S. aluminum production" claim are Century's; the project has not reached final investment decision, which management elsewhere on this call places at the end of 2026.
Jesse Gary, President and CEO — prepared remarks, Q4 2025 earnings call: No company is more dedicated to U.S. aluminum production than Century. Century is already the largest producer of aluminum in the United States, smelting nearly 60% of the country's primary aluminum, employing more American primary aluminum workers than any other company, and thanks to President Trump's leadership and the Section 232 program, we plan to invest billions more in new and expanded production at Mt. Holly and our Oklahoma smelter project. This has all been enabled by President Trump and the administration's policies, including the Section 232 program, which continues to be enforced with no exceptions and no exemptions. […] To this end, Century made substantial progress on our new smelter project in 2025, culminating in our recently announced partnership with EGA to build the first new smelter in the U.S. in nearly 50 years. By combining efforts with EGA, we will pair Century's significant operating and supply chain expertise in the U.S. with EGA's world-class expertise in aluminum smelting technology, construction, and operation. As partners in the Oklahoma smelter, EGA will own 60%, and Century will own 40%, and the project will benefit from our previously announced $500 million grant from the U.S. Department of Energy. The project recently retained Bechtel to complete the next stage of engineering work, which should enable a final investment decision in groundbreaking by the end of the year. […] This has allowed us to increase the expected size of the smelter to 750,000 metric tons, which alone will more than double total U.S. aluminum production and expand Century's position as the largest American producer.
p. 1 · Read in context →
Century's 10-K statement of why its asset locations matter: production inside the two tariff walls, sized against regional deficits it does not quantify. This is the structural fault line with Alcoa, whose Québec smelters ship into the US from outside the tariff wall and whose Australian and Brazilian output sits outside both.
Century Aluminum Company, Form 10-K (FY2025), Item 1 — Competitive Advantages: Duty Free Access to our Major Customer Markets. Our facilities benefit from international and national trade laws and regulations. For example, the European Union imposes import tariffs on primary aluminum from producers outside the European Economic Area (the "EEA"), which includes Iceland, and the U.S. currently imposes a 50% tariff on certain primary aluminum imports into the United States. Our U.S. and Icelandic businesses currently access these respective markets duty-free which provides us with an advantage over our competitors who sell into these markets under these tariff regimes. […] The U.S. and the E.U. are the second and third largest aluminum consuming regions in the world but do not produce enough aluminum domestically to satisfy their own demand. Our production locations within these markets provide us with a significant competitive advantage over our foreign competitors by providing our customers with short, reliable supply chains, better technical service and opportunities for value added collaboration. Our U.S. facilities benefit from the proximity to our U.S. customer base, allowing us to capture the Midwest premium and providing a competitive advantage in freight costs over our foreign competitors.
p. 13 · Read in context →
Century's sizing of the 2026 supply shock — roughly 2.5 million tonnes of Gulf capacity disrupted, widening its own global deficit estimate — and its reading of the April 2 executive order that it says closed Section 232 valuation loopholes in downstream extruded products. Both the disruption tonnage and the deficit are Century estimates presented on its own slides; the deficit figure, completed on the following page, is 1.4 million tonnes.
Jesse Gary, President and Chief Executive Officer — prepared remarks, Q1 2026 earnings call: In the U.S. specifically, we are already beginning to see increased value-added product demand following President Trump's April 2 executive order that closed valuation loopholes that importers have been using to cheat the Section 232 system, especially in downstream extruded products. We are grateful to President Trump for taking this additional action to ensure that the entire U.S. aluminum supply chain is able to grow and expand to meet our domestic national security needs with American metal. […] Turning to the supply side. The importance of ensuring secure U.S. supply chain has never been so evident as today following disruptions in production in the Middle East. We estimate that approximately 2.5 million tons of production in the Gulf countries has been disrupted by either production curtailments due to raw material shortages arising from the closure of the Strait of Hormuz or direct Iranian drone and missile attacks. We stand by our industry colleagues who have been so unfairly affected by such attacks. Note that, while the large majority of Middle Eastern metal goes to the European and Asian markets, Century has been supporting our existing U.S. customers that have been impacted by the Middle East disruption through the placement of our expansion tons from Mt. Holly to repair these strained supply lines and ensure our U.S. customers have access to the metal that they need. The timing of our Mt. Holly restart could not be better in this regard, providing additional American metal units to the domestic market. As you can see on Slide 6, the Middle Eastern disruption has expanded our expected 2026 global deficit
p. 1 · Read in context →
Rio Tinto (Aluminium & Lithium) (RIO)
The closest structural mirror to Alcoa anywhere: bauxite mining, alumina refining and hydro-powered smelting under one roof, with Canadian and Australian assets facing the same tariff and energy questions. Rio is simultaneously Alcoa's partner — the ELYSIS inert-anode joint venture and co-ownership of the CBG bauxite mine in Guinea — and its rival for the same US value-added customers. Only the Aluminium & Lithium disclosures are used here; iron ore, copper and lithium are outside the competing business.
Rio Tinto's disclosure of how dependent its aluminium book is on the US: 59% of total volumes priced off the Midwest premium in 2024, versus 57% in 2023. This is the exposure that the 2025 tariffs then repriced, and it is the same premium that flows through Alcoa's US-delivered tonnes.
Rio Tinto, 2024 Annual Report — Aluminium, financial performance: We achieved an average realised aluminium price of $2,834 per tonne, 4% higher than 2023. The average realised aluminium price comprises the LME price, a market premium and a value-added product (VAP) premium. The cash LME price averaged $2,419 per tonne, 8% higher than 2023, while in our key US market, the Midwest premium duty paid, which is 59% of our total volumes (2023: 57%), decreased by 17% to $427 per tonne (2023: $512 per tonne). Our VAP sales represented 46% of the primary metal we sold (2023: 46%) and generated product premiums averaging $295 per tonne of VAP sold (2023: $354 per tonne).
p. 106 · Read in context →
Rio's CEO in February 2025, before the tariff rate was settled, describing the option Alcoa also holds — redirect metal away from the US and let others fill the gap. Note the framing that a uniform tariff is neutral and only a selective one bites. Rio's 2025 accounts settled the question: US$1,059 million of cost from tariffs imposed on sales to the US, against nil in 2024 (2025 Annual Report, note 7).
Jakob Stausholm, Chief Executive Officer — answering Rahul Anand (Morgan Stanley) on US tariffs, FY2024 results call: Bear in mind that we produce a lot in the U.S., different products. And then a number of products are being imported for us into the U.S. So, first of all, the economic impact on tariffs to Rio Tinto might be both pluses and minuses, and we don't know whether the net will be positive or negative. But it really depends on how the tariff hit.
If all countries are getting a tariff, the impact for us is zero. The problem is if it's only one country and the country we are selling into. But then, of course, we could redirect our aluminium to other markets, and other producers will supply the U.S. market.
p. 13 · Read in context →
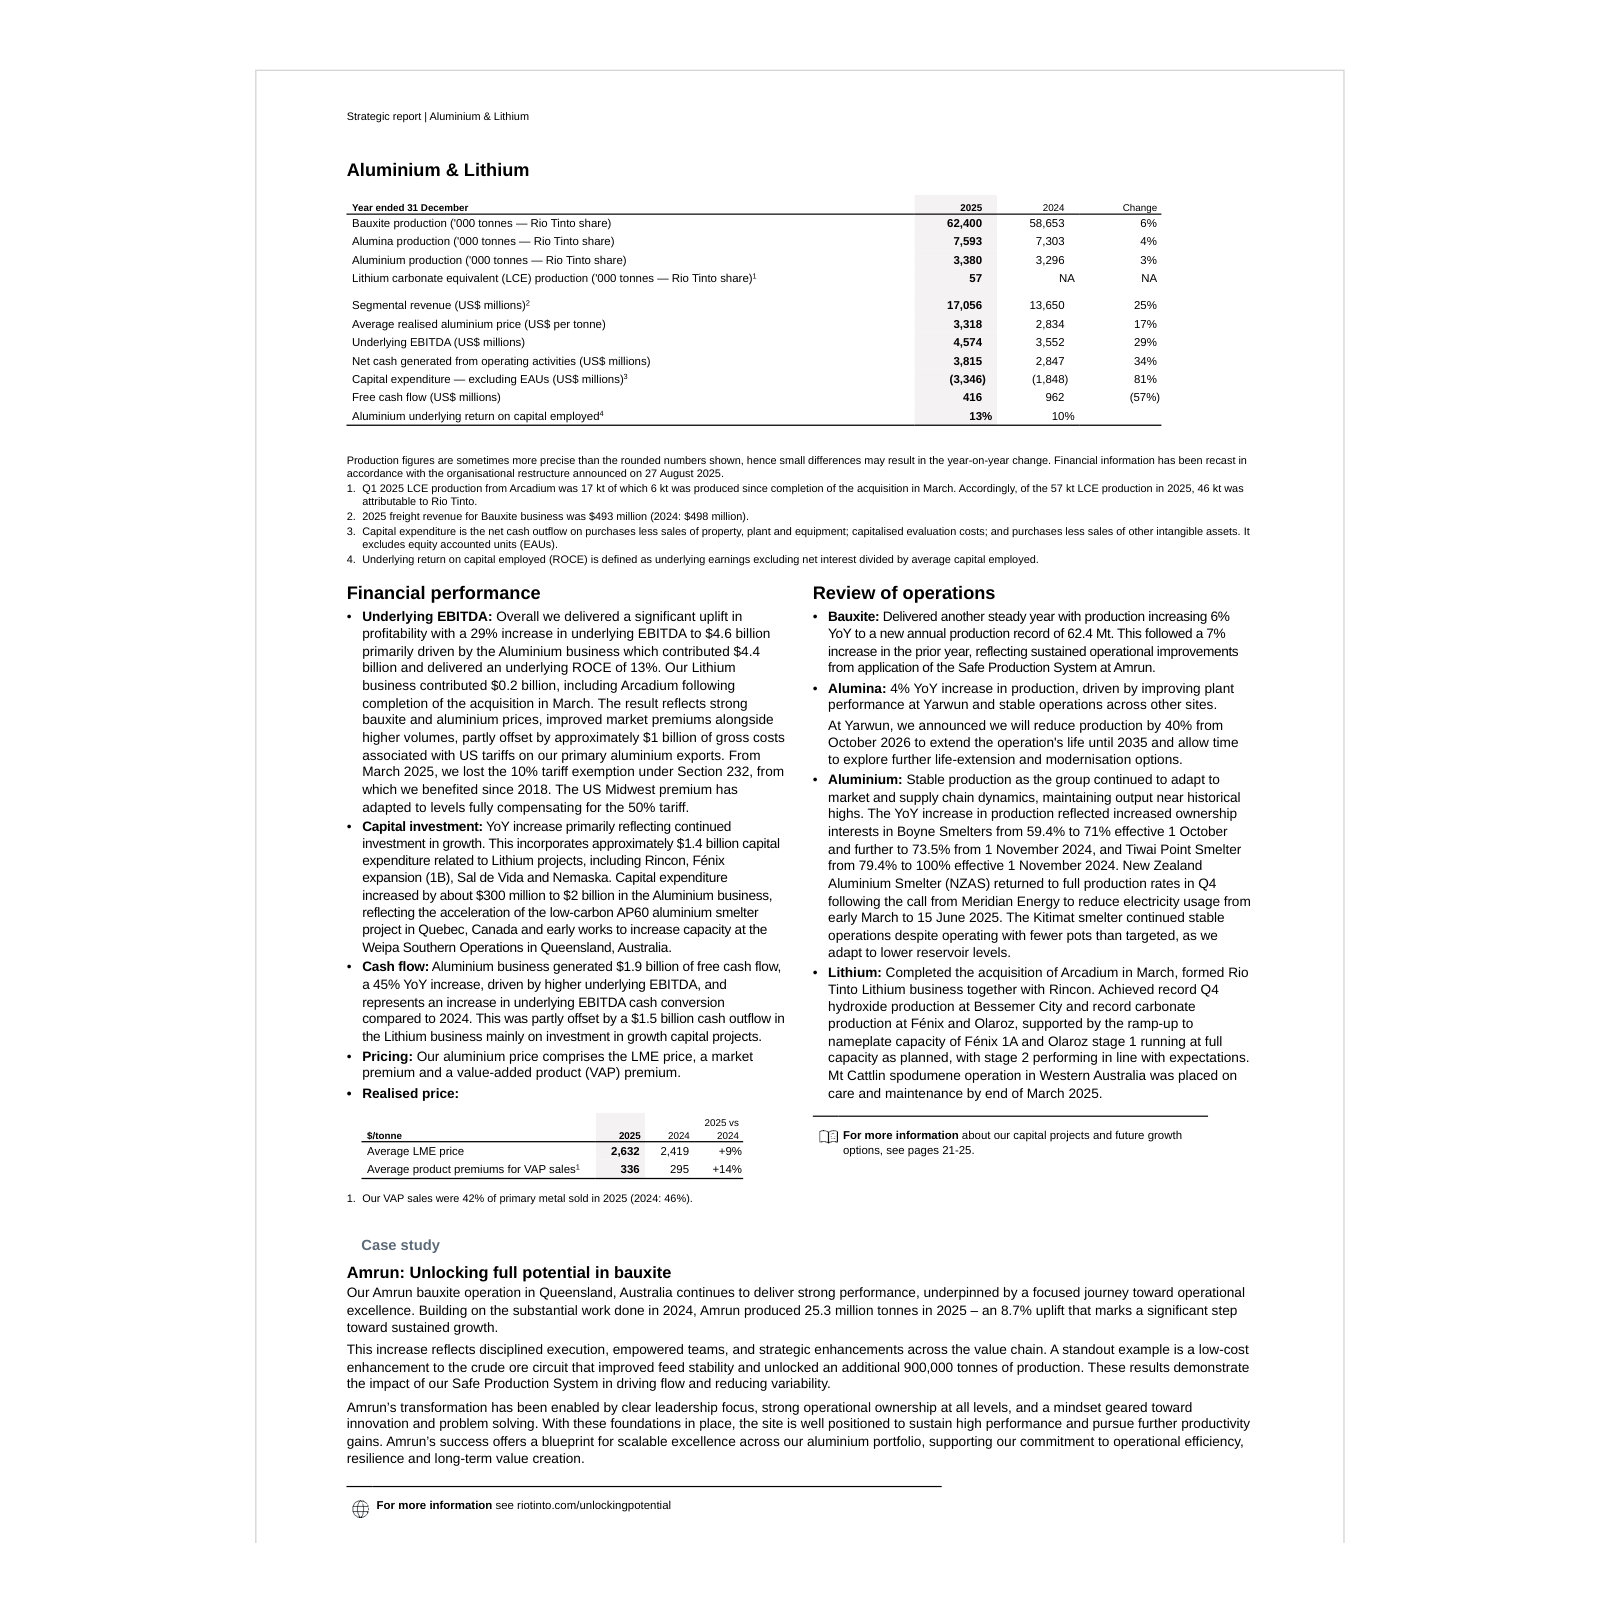
Norsk Hydro ASA (NHY)
The other fully integrated Western producer: Paragominas bauxite feeding Alunorte — which Hydro calls the biggest alumina refinery in the world outside China — plus 2.1 million tonnes of primary capacity. Hydro's annual report is the most detailed published account of the two prices that drive Alcoa's segments, the alumina index and the regional metal premiums, and it publishes a 2026 balance view that runs directly against Century's.
Hydro's description of the refining asset that anchors the non-Chinese alumina market and its published cost build. The 85%-of-cash-cost split across bauxite, energy and caustic soda is the same cost structure that moves Alcoa's Alumina segment; Hydro's caustic share is disclosed at roughly 16% for 2025.
Norsk Hydro, Integrated Annual Report 2025 — Business areas, Bauxite & Alumina: Hydro Bauxite & Alumina covers Hydro's bauxite mining activities in
Paragominas and the company's 62 percent interest in the Brazilian alumina refinery, Alunorte, both located in Pará State, North of Brazil. Alunorte is the biggest alumina refinery in the world outside China, with nameplate capacity of 6.3 million tonnes per year. […] The main cost drivers for alumina refining are bauxite, energy and caustic
soda. These represent around 85 percent of cash costs, where caustic soda represented around 16 percent of cash costs in 2025. Energy costs are a mix of gas, coal, and electricity, and account for about 30 percent of the total costs.
p. 22 · Read in context →
Hydro's account of the 2025 alumina reversal: the Platts index from USD 672 to USD 306 per tonne, a 24% lower annual average, and an alumina-to-LME ratio ending the year at a record low. That ratio is the single largest swing factor in Alcoa's Alumina segment earnings.
Norsk Hydro, Integrated Annual Report 2025 — Market development and outlook, Bauxite and alumina: Following very tight alumina markets and all time high nominal prices in 2024, the global metallurgical alumina market rebalanced in 2025: production growth of 3.1 percent exceeded demand growth of 1.8 percent, driving prices lower throughout the year. The Platts alumina price index started the year at USD 672 per mt and decreased throughout the year, ending the year at the annual low of USD 306 per mt. […] The Platts alumina price index averaged USD 384 per mt for the year, a 24 percent decrease compared to 2024 (USD 504 per mt). […] The price index at the end of 2025 represented 10.2 percent of the three month aluminium price quoted on LME, a new all time low.
p. 34 · Read in context →
Hydro's premium data for 2025: the US Midwest premium quadrupling from USD 515 to USD 2,007 per tonne on tariffs, while the European premium fell — and Hydro attributes part of that European weakness to Canadian metal displaced into Europe. Alcoa is one of the largest shippers of Canadian metal, so both halves of this sentence are read against its book.
Norsk Hydro, Integrated Annual Report 2025 — Market development and outlook, Primary aluminium: The U.S. and European standard ingot premiums started the year at USD 515 per mt and at USD 360 per mt respectively. European standard ingot premiums were volatile throughout the year reaching a bottom of USD 188 per mt in summer and ending in December at USD 335 per mt. The premium was under pressure during the first half of 2025 due to a flow of Canadian metal coming into the market, but have since regained footing on a tightening market. […] The U.S. Midwest standard ingot premium had a volatile year as well, starting the year at USD 515 per mt and ending the year at USD 2,007 per mt. In general, the U.S. Midwest increased on increased tariff rates on aluminium into the U.S.. Average U.S. Midwest standard ingot premium increased USD 868 per mt compared to 2024, while corresponding standard ingot premiums in Europe decreased about USD 62 per mt.
p. 35 · Read in context →
Aluminum Corporation of China Limited (Chalco) (2600)
The largest producer in both of Alcoa's segments. Chalco competes with Alcoa less for customers than for the price itself: Chinese refineries set the marginal alumina tonne, and Chalco's annual report is the most explicit published sizing of that market. It is also the peer that names Alcoa directly, citing the Kwinana refinery closure as a driver of the 2024 alumina spike.
Chalco's own ranking claim, unqualified and unsourced: first in the world in alumina, fine alumina, electrolytic aluminum, high-purity aluminum and gallium capacity. The descriptive scope — bauxite and coal mining through alumina, primary metal, alloy and carbon — is the same vertical integration Alcoa describes for itself, which is why Chalco's capacity decisions land directly on Alcoa's realised prices rather than on its customer list.
Aluminum Corporation of China Limited, Annual Report 2025 — Corporate Profile: The Company and its subsidiaries (the “Group”) is a leading enterprise in aluminum industry in China, ranking among the top in the global aluminum industry in terms of overall strengths. The Group’s alumina, fine alumina, electrolytic aluminum, high purity aluminum and gallium metal production capacity all rank first in the world, and is a large manufacturer and operator with integration of exploration and mining of bauxite, coal and other resources; production, sales and technology research of alumina, primary aluminum, aluminum alloy and carbon; international trade; logistics business; thermal and new energy power generation.
p. 4 · Read in context →
Chalco's sizing of the market Alcoa's Alumina segment sells into: 150.5 million tonnes of global output against 147.3 million tonnes of consumption in 2025, with China at roughly 62% of supply, and world capacity utilisation at 75.6%. The spare capacity implied here is the structural reason the international price fell 22.7%.
Aluminum Corporation of China Limited, Annual Report 2025 — Chairman's Statement, alumina market: In 2025, the average domestic spot price of alumina was RMB3,221 per tonne, representing a year-on-year decrease of $21.1\%$ . In the international market, the overall trend of alumina prices was basically consistent with that of the domestic market, with a full-year average price of USD388 per tonne, representing a year-on-year decrease of $22.7\%$ . […] According to the statistics, the global output and consumption of alumina for 2025 were 150.49 million tonnes and 147.33 million tonnes, respectively, representing a year-on-year increase of 6.0% and 1.9%, respectively; the domestic output and consumption of alumina were approximately 92.94 million tonnes and 88.67 million tonnes, respectively, representing a year-on-year increase of 8.3% and 1.9%, respectively, accounting for 61.8% and 60.2% of global output and consumption, respectively. As of the end of December 2025, the alumina capacity utilization rate in the world was 75.6%, while that of the PRC was 80.9%.
p. 46 · Read in context →
A competitor's account of the 2024 alumina spike that names Alcoa's own asset: the Kwinana curtailment, at roughly 1.8 million tonnes per year, listed alongside Rio Tinto's Queensland gas-pipeline outage as the supply losses that carried the international price to USD 810 per tonne. Useful as an outside check on how Alcoa's curtailment decision was read by the largest producer in the market.
Aluminum Corporation of China Limited, Annual Report 2024 — Chairman's Statement, international alumina market: In terms of the international market, there were frequent disruptions in the supply side of alumina in 2024. In early March, due to the impact of the Australian natural gas pipeline fire, the operating capacity of Rio Tinto's Yarwun alumina plant and Queensland alumina plant decreased by approximately 1.2 million tonnes per year. The planned resumption was postponed from June to the end of the year. Rio Tinto Group announced force majeure in May regarding the shipment of two alumina plants in Australia. In April, due to the decline in ore grade and high costs of outdated equipment, Alcoa shut down its Kwinana alumina plant in Western Australia, affecting production capacity of approximately 1.8 million tonnes per year. Starting from the second quarter, overseas alumina supply further declined, supporting prices to continue rising and reaching a high point for the year by early December. Afterwards, due to the lifting of the force majeure on alumina exports by Rio Tinto Group and the return of normal operation of alumina plants in Australia, alumina prices quickly fell back after reaching their peak. In 2024, the highest international alumina (FOB) price was USD810/tonne, the lowest was USD354/tonne, and the average price was USD502/tonne, representing a year-on-year increase of 46%.
p. 50 · Read in context →
Vedanta Limited (Aluminium) (VEDL)
India's largest primary aluminium producer and, on its own account, on track to the third-largest capacity outside China. Vedanta matters to an Alcoa reader for two reasons: it is the growth tonnage arriving in the ex-China market Alcoa serves, and it publishes per-tonne cost of production for both alumina and molten metal — a cost-curve yardstick Alcoa does not disclose in that form. Only the Aluminium segment is used; zinc, oil and gas and iron ore are separate businesses.
Vedanta's sizing of the market Alcoa's Aluminum segment sells into: about 73.8 million tonnes of CY2025 global production, roughly matched by demand, plus a claimed 46% share of an Indian market growing near 10%. The first elision drops a sentence putting the CY2025 balance at a deficit of about 0.2 million tonnes — it is elided because our text index of that line is garbled, not because it cuts against the rest. Set this against the 2026 forecasts the peers publish in the same season: Norsk Hydro calls a 0.2 million tonne surplus, Century a 1.4 million tonne deficit.
Vedanta Limited, Integrated Annual Report FY 2025-26 — Segment Review, Aluminium: In CY 2025, global primary aluminium production was \~1.1% up from last year and around 73.8 million tonnes. […] China’s production increased in CY 2025 was 44.2 MTPA. In India, the demand surged by \~10% to around 6 million tonnes in FY 2025-26. […] For the Rest of the World, 2026 is
expected to experience volatile market due to macroeconomic conditions like tariffs from USA, and geopolitical situations impacting trade flow & fuel and commodity prices and decrease in global production capacity due to expected shutdown of South32 Aluminium Smelter (Mozal) from March 2026. […] Vedanta is India’s largest primary aluminium producer with an annual capacity of \~2.4 million tonnes. The Company’s product portfolio includes aluminium ingots, primary foundry alloys, wire rods, billets, and rolled products which cater to varied industries globally such as energy, transportation, construction and packaging, aerospace and defence, among others. It has achieved domestic market share of 46%.
p. 113 · Read in context →
The cost-curve comparison Alcoa's own filings do not present this way: Vedanta reports molten aluminium at US$1,752 per tonne and alumina at US$372 per tonne for the year to March 2026, both falling, against an LME price that closed the period at US$3,585. Vedanta's cost base is coal-fired and captive-bauxite-fed, so it is not like-for-like with Alcoa's hydro-powered Canadian and Norwegian smelters, but it sets the floor a low-cost entrant can operate at.
Vedanta Limited, Integrated Annual Report FY 2025-26 — Aluminium, unit costs and prices: LME prices which had fallen to levels of US$ 2,300/tonne in Apr-25 reached the highs of US$ 3,300/tonne in Jan-26. However, in the absence of fresh market drivers, prices reverted to previous support levels of around US$ 3,000/t. However, in March, heightened geopolitical developments involving the United States, Israel, and Iran led to increased regional tensions and temporary disruptions to smelting operations, resulting in an uptick in prices. The rally in prices has been augmented by operational disruptions at EGA and Alba smelters on 28 March. The year concluded with an LME price of US$ 3,585/t on 31 March, with a month average of US$ 3,370/t. […] Cost of production (CoP) of alumina was at US$ 372 per tonne, up 5% Y-o-Y, majorly due to lower domestic bauxite mix.
CoP of molten aluminium for FY 2025-26 was at US$ 1,752 per tonne, down 5% Y-o-Y, majorly due to reduction in Alumina and Power costs on account of higher captive Alumina mix, softened market alumina prices, & lower coal costs. This was offset to an extent by higher CPC prices & other processing cost.
p. 131 · Read in context →
More peer documents
Q3_FY2025 — 8 pages · Century's capital-allocation framework and the earlier version of the Oklahoma smelter plan, before the EGA partnership was announced — the baseline against which the 40/60 JV structure should be read. · Open →
Q2_FY2025 — 8 pages · The first full quarter after the US tariff moved to 50%; management's contemporaneous read on how fast the Midwest premium repriced, which is the pass-through Alcoa's US-delivered tonnes also received. · Open →
CENX_annual_report_FY2024 — 117 pages · Contains Century's detailed Jamalco property disclosure, including the history of Alcoa's mining concessions and refinery in Clarendon — useful background on the asset Alcoa sold out of in 2014. · Open →
NHY_annual_report_FY2024 — 283 pages · The prior-year edition of the same market chapter, written at the top of the alumina spike; reading the two side by side shows how fast a peer's published view of the alumina market inverted. · Open →
The Answer
Does not fit the framework (P1 not met)
Alcoa clears the universe screen and trips no exclusion, but the framework's lone gate — year-10 durability — is not met, and nothing offsets a gate. Confidence is low: the name-mask probe left a load-bearing probability gap of 0.21, above the 0.20 line, so a prior-driven-risk flag stands. There is no watchlist-only flag, no exclusion hit, and nothing the jury recorded as contested.
Here is the decisive point. Alcoa is a price-taker at the bottom of a fragmented, globally traded commodity chain — a 3.1% share of world primary aluminum and 6.4% of world alumina, at prices set on the LME and the Alumina Price Index [1]. Its larger segment by capacity sold below cash cost in the first half of 2026, at a realized $329 per tonne against a $352 operating cost [2]. The framework's gate asks for very high conviction that both year-10 revenue and year-10 adjusted free cash flow will be higher than today's; on a business with no market-structure moat and a segment currently unprofitable, that conviction is absent.
Market Cap ($B)
Live Drawdown
Adj. FCF Yield (FY25)
P(impairment temporary)
Sources: market cap and yield derived from the FY2025 Statement of Consolidated Cash Flows [3] and the 31 July 2026 close; drawdown from data/prices/daily.json; temporary probability from the blind adversarial trial (ruchir/trial/tally.json).
This tab renders the deterministic tally (ruchir/fit_tally.json). It reports the machinery's verdict and the arithmetic behind it; it does not re-adjudicate the case. Each evidence tab linked below carries the full treatment.
Universe and Exclusions
Universe — both tests clear. Alcoa Corporation is a Delaware corporation whose primary listing is the New York Stock Exchange under "AA", trading in U.S. dollars — not a Chinese company, a Chinese ADR, or an ADR of any kind [4]. Market capitalization is $11.81 billion — 261 million shares at the $45.26 close of 31 July 2026 — 18.1% above the $10 billion line, with a break-even at $38.31 [5]. Both universe criteria are met; see Business.
Exclusions — no hit, one signal worth stating anyway. Every hard exclusion was checked and none fired:
- Auto OEM (X1) — not a hit. Alcoa manufactures no vehicles; it is an upstream producer of bauxite, alumina and primary aluminum ingot, two steps removed from any automaker [6].
- Promotion pattern (X2) — not a hit. The exclusion needs both a repeated promise-versus-delivery gap and weak insider ownership. Only the ownership prong is present: insiders hold about 0.25% of shares, but the stock-ownership guidelines (6x salary for the CEO) are real and met, and the delivery record is mixed rather than promotional — of six commitments, two were kept or beaten, one half-kept, one late, two missed, with both misses disclosed by management in the same numbers used to set the targets [7]. One prong is not two; see Self-Help.
- Structural decline (X3) — not a hit, but the counter-fact is the reason P1 fails. The framework's exclusion targets a secular, non-mean-reverting decline diagnosed as such; the jury did not classify Alcoa there, and the numeric disqualifier for the gate — high-single-digit revenue decline for three straight years — does not fire (
fit_features.revenue_trajectoryrecords zero consecutive decline years). The counter-fact stands in the same breath: the physical base has shrunk even as priced revenue rose. Alumina production fell 27.3% and consolidated smelting capacity 22.2% over the decade [8]. That erosion did not trip the exclusion, but it is exactly what denies the year-10 gate its conviction; see Durability. - Consensus-saturated story (X4) — not a hit. Alcoa trades at 0.92x FY2025 sales with a sawtooth price history since the 2016 separation — the opposite of the extreme-multiple, consensus-owned growth narrative the exclusion targets.
- China dependence (S1) — no sensitivity flag. Disclosed China revenue and China long-lived assets are effectively zero, so the framework raises no China sensitivity flag. The honest counter-fact: the exposure runs through price, not the balance sheet — Chinese and Indonesian capacity sets the alumina price that has driven Alcoa's larger segment to negative EBITDA. This is a price channel, not a China revenue dependence, and the fact test scores it clean; see Business.
Pattern Match
Ruchir's system recognizes four setups. Alcoa's live 46% drawdown, dated triggers and cheap headline yield make it look like a dislocation entry, but on the pattern's own checks it fits none of the four cleanly.
It is not a cyclical-bank bottom (setup 1) and not a high-dividend-yield case (setup 2 — the dividend yields 0.88%). The closest analogue is setup 3, the healthcare/insurance forecasting error — an industry-wide misforecast that reprices 1:1 and then mean-reverts as the book readjusts. The mechanism differs in the way that matters: an insurer's premiums reprice on a regulated schedule, whereas Alcoa's recovery depends on an undated LME aluminum price, not a repricing calendar with regulatory friction. It is also not a quality tech monopoly on a fear dip (setup 4): the monopoly/duopoly structure that setup relies on is absent — Alcoa is a single-digit-share price-taker [9]. The setup the price advertises is a commodity-price bet, not the industry-wide repricing the framework's dislocation pattern hunts.
The Pillar Ledger
The criteria and where each sits against the framework's reference lines:
Source: ruchir/fit_tally.json; deciding numbers from the surviving claims cited in the sections below.
Year-10 gate (P1) — not met
This is the criterion that decides the verdict. The jury voted not met on all four seats. Conviction in the framework comes from market structure, regulatory entry barriers, capital intensity, essential products and long history; only one of those applies cleanly to Alcoa. Market share, FY2025: primary aluminum 2,319 kmt of a 74,520 kmt world, 3.11%; alumina 9,640 kmt of 150,490 kmt, 6.41% — and even the "outside of China" leadership Alcoa claims covers only about 41% of the market [10] [11]. The Alumina segment's unit economics inverted: a realized-price-less-cost spread of +$163 per tonne in FY2024 fell to +$98 in FY2025 and to −$23 in the first half of 2026, and management wrote the segment's goodwill to zero [12] [13].
The strongest surviving counter-fact sits in the same treatment. Capital intensity is a genuine barrier — Western greenfield smelter capex runs $7,500–$9,100 per tonne against roughly $1,150 in China, and Alcoa has no greenfield plans anywhere because no site clears its return hurdle [14]. Management's own thesis is that the world will need roughly 7 million more tonnes of ex-China aluminum and 18 million more tonnes of alumina over the decade, and that new supply is hard to build [15]. That is a real barrier to entry; it is not the same as a monopoly's pricing power, and it did not stop 13.4 million tonnes of Chinese capacity being added in a decade. Under the gate's rule, genuine doubt resolves to not met — and here the doubt is not merely genuine, it is the majority reading. Full treatment in Durability.
FCF consistency (P2) — not met
The framework wants a stable rolling five-year average of adjusted FCF. That series cannot be computed for Alcoa — the deterministic feature file returns not_computable for every year because stock-based compensation is absent from the structured cash-flow feed — so the reported-FCF substitute stands in, and it is unpredictable. Reported FCF ran −$715M, $819M, $49M, $307M, $41M, $530M, $342M, −$440M, $42M, $567M across FY2016–FY2025; the rolling five-year average moves between $100M and $349M, a coefficient of variation of 0.45, with negative years in FY2016 and FY2023 [16]. The counter-fact: SBC is small when Alcoa's own filings disclose it ($41M in FY2025), so the illustrative FY2025 adjusted figure is close to reported — but the negatives here are price and restructuring events, not the every-5-to-8-year underwriting cycle the framework treats as healthy. See Yield.
Dislocation and yield (P3) — event yes, capitulation no, yield short
P3a (met). The drawdown is real and dated: −46% from an $83.79 close on 2 June 2026 to $45.26 on 31 July, with two primary-document triggers — the 30 June South32 acquisition and the 16 July Q2 print. Those two events explain only about 19.5% of the fall; roughly 82% was an undated June retreat in the aluminum price that management itself attributes to sentiment, saying the metal "has gone to pre-Iran conflict levels" though the underlying supply disruption remained [17]. See Dislocation.
P3b (not met). The fear gauge does not show capitulation. The volume-spike multiple is 1.23x — on both the feature-file leg and the live June–July leg — against the framework's 2x reference line, and no session reached the 4.8x–6.7x band of this stock's ten largest historical volume days. This was a price slide, not an emotional flush.
P3c (not met). Adjusted FCF yield is 4.45% on FY2025 figures and 0.16% on the three-year average, against the 8% fortress reference line the FY2025 balance sheet selects — 355 basis points short on the better of the two readings [18]. The counter-fact: net debt of $842M against $1,940M of FY2025 segment EBITDA is 0.43x, genuinely fortress-class [19] — but a fortress balance sheet sets a higher yield bar, not a lower one, so the strong balance sheet makes the shortfall wider, not narrower.
P3d (not met; probability 0.19, spread 0.24). Consensus forward free cash flow clears the bar on its face — 13.25% for FY2027, 16.09% for FY2028 on today's market cap — but falls to 7.18% and 9.85% once the framework's SBC and acquisition deductions are applied, and the announced $3.1 billion South32 purchase reinstates a $620M-a-year acquisition deduction that pulls the adjusted figure back below the line [20]. The probability of clearing the applicable 10% bar in any single year FY2027–FY2029 is put at roughly 15%. This is the widest spread on the board (0.24); the jury still agreed on the direction. See Yield.
Balance sheet and self-help (P4) — outlasts, but the engine is off
P4a (not met). The balance sheet can comfortably outlast a multi-year trough: after the May 2026 redemption of the 2028 notes there is no bond maturity before 2029, against roughly $3.0 billion of liquidity, and both revolver covenants clear by wide margins [21]. That is the supporting fact. Against it: capital allocation has been ranked with debt repayment first on every call from July 2023 to April 2026, and the balance resolved on 30 June 2026 in favour of a $3.1 billion cash acquisition sized "not to exceed a leverage ratio of 2.0x" [22] — the framework's own falsifier of a pivot to debt paydown and growth at the moment repurchases would matter most.
P4b (not met — the hard-fail condition). Share count is rising, and the driver is acquisitions settled in stock: 178 million weighted-average shares in FY2023 to 261 million in FY2025, +46.6%, with about 17 million more committed to South32. No shares were repurchased in FY2023, FY2024, FY2025 or the first half of FY2026 [23]. A rising count on serial acquisition is the condition the framework treats as disqualifying on its own; the buyback flywheel the dislocation is supposed to unlock is not turning. See Self-Help.
P4c (not applicable). The dividend is $0.40 per share annualized — a 0.88% yield at $45.26, far below the roughly 4% level at which the framework's dividend-safety test engages. For the record, it is covered about 5x by FY2025 adjusted FCF and has been held at $0.10 a quarter since November 2021, through the FY2023 loss year [24].
Diagnosis (P5) — temporary lean, meaningful permanent tail
The blind adversarial trial — two opposing cited briefs, three independent judges reading in different orders — put the probability the impairment is temporary at 0.66 (per-judge 0.57, 0.66, 0.68; mean 0.64; spread 0.11; recorded not contested). The arithmetic behind it: on the most defensible pairing, a pre-spike price base against a permanent reading, price damage of about $4.9 billion exceeds value damage of about $2.0 billion — a gap near $2.9 billion, but not the two-thirds-cut-with-NPV-intact pattern of the framework's Centene precedent. Half the drawdown is the give-back of a two-week geopolitical price spike; the line that actually broke is the Alumina segment, and part of that impairment is structural [25]. P5 leaning temporary does not rescue the case: the gate (P1) is upstream of it and nothing offsets a gate. See Damage Math.
Instrument context (I1) — not verifiable
The tally records I1 as not verifiable. Listed options on Alcoa do run to 21 January 2028 — about 17.6 months, clearing the 12-month line and just short of the 18-month target — and at-the-money implied volatility on that expiry is near 59% against reference lines of up to about 55 acceptable and 60–70 elevated. But the I1 fact test asks for open interest and bid-ask spreads from a dated, citable source, and the spreads could not be sourced from any document in the corpus; the option facts came from third-party web pages with no filing page. The criterion therefore resolves to not verifiable rather than exists. See Clock.
What a 3x-in-3-Years Would Require
The framework's target test cannot be rendered from the tally as arithmetic: re_rating_math is null, with the note "Re-rating math unavailable because the applicable bar or normalized adjusted FCF is missing." The reason is the same one that dogs P3c — the adjusted-FCF series the bar would price is not_computable in the feature file, so no price-at-bar can be struck cleanly.
What the run can say about the re-rating mechanism it points to instead: restoring the roughly $10.1 billion of market value lost since 2 June 2026, at the ~4.2x EV/EBITDA that fall implies, would take about $2.4 billion of additional EBITDA — equivalent to a +$1,008 to +$1,154 per tonne move in the LME aluminum price, 21% to 24% above the $4,752 per tonne Alcoa realized in the second quarter [26]. No dated corporate event sets that price. On this name's own nine-and-three-quarter-year record, an eighteen-month recovery to the prior high happened about 22% of the time — roughly one chance in five, with a median eighteen-month forward return of 0.0% from comparably depressed sessions. The base rate is in Clock; it is context for the target test, not a recommendation.
Contested and Undetermined
Nothing was contested; nothing was undetermined. No criterion carries a contested verdict, and none resolved to cannot-determine — the tally's flags.contested list is empty and no seat returned a missing-datapoint verdict. The two non-standard resolutions are neither: P4c is not applicable (the dividend is too small to trigger the test) and I1 is not verifiable (option spreads could not be sourced). The widest genuine disagreement was P3d's 0.24 probability spread, but the four seats still agreed on its not-met direction.
Provenance
Source: ruchir/fit_tally.json (provenance) and ruchir/refutations.json.
Two model families sat the jury and agreed on both the gate and the overall verdict, which is why the verdict itself is not in doubt; confidence is nonetheless low because the name-mask probe — which re-runs a seat blind to the company's identity — left a load-bearing probability gap of 0.21, just above the 0.20 line, and that raises a prior_driven_risk flag: it means a model's prior about the name may have moved a probability more than the evidence alone should. The skeptic pass pressed 51 claims and refuted none, so no cited claim on this tab was overturned in review.
The Falsifier Ledger
These are the standing conditions that would break, or confirm, the framework read — the first five are the framework's own templates, the rest are the name-specific trip-wires the tally recorded with their thresholds, directions and windows. Reproduced verbatim from ruchir/fit_tally.json:
Data Gaps
The run could not close several gaps, from the tally's list. The framework's own yield basis is the largest: fit_features.adjusted_fcf, adjusted_fcf_yield, yield_baseline, fcf_stability, float_retirement_years and balance_sheet_class are all not_computable because stock-based compensation is missing from the structured cash-flow feed for every year FY2016–FY2025 (though the filings themselves disclose it for FY2019 onward), so every adjusted figure on this report was rebuilt from the filed statements rather than taken from the feature file. Beyond that: no pro-forma financials for the South32 AliGroup assets exist in the corpus, so the post-close year-10 revenue and adjusted-FCF base cannot be computed; no LME or alumina index price series is in the structured data, so the price path driving the whole re-rating cannot be independently charted; short interest is entirely unavailable (FINRA returned no rows), and the insider-transaction and beneficial-ownership records both pre-date the June 2026 fall, so the identity of the seller cannot be evidenced; destination-basis China revenue is not disclosed, so the S1 quantification is an upper bound on a point-of-sale basis only; and the capitulation-gauge feature measures the already-healed 2024–25 drawdown rather than the live 2026 leg, which the Dislocation tab re-derives.
What Alcoa Is
Alcoa mines bauxite, refines it into alumina, and smelts alumina into primary aluminum, selling both at prices set on the London Metal Exchange and a published alumina index [1]. FY2025 revenue was $12.8 billion from 25 sites in eight countries. The universe screen clears on both tests: a Delaware company with its primary listing on the NYSE, and a market capitalization of $11.8 billion. The market structure is fragmented and price-taking rather than oligopolistic — that evidence is laid out below.
A cold reader can hold the business in two sentences. Alcoa digs bauxite ore out of the ground in Australia, Brazil and Guinea, refines it into alumina powder at five refineries, and runs that alumina through eleven smelters in seven countries to make aluminum ingot, billet and slab, which fabricators turn into cans, car parts, window frames and wire. It owns no downstream fabrication and sets no prices: aluminum sells at the LME quote plus a regional and a product premium, and alumina sells against the Alumina Price Index that Alcoa itself computes from three published spot indices [2].
The company became an independent public company on November 1, 2016, in the separation of the former Alcoa Inc. [3]. The operating lineage runs much further back: the business was founded in 1888 by Charles Martin Hall, whose electrolysis process is still how the world makes aluminum [4].
FY2025 Revenue ($M)
Market Cap, 31 Jul 2026 ($M)
Employees
Gross Plant ($M)
Sources: revenue and gross plant, FY2025 Form 10-K [5] [6]; headcount of approximately 14,900 in 16 countries [7]; market capitalization derived from fit_features.market_cap.usd (261.0 million shares at the 31 July 2026 close of $45.26).
The Universe Screen
Listing. Alcoa Corporation is a Delaware corporation whose common stock is listed on the New York Stock Exchange, its principal market, trading in U.S. dollars under the symbol "AA"; a secondary line of CHESS Depositary Interests, each representing one share, trades on the Australian Stock Exchange in Australian dollars under "AAI" [8]. It is neither a Chinese company nor an ADR of any kind. The listing test is clean, and the current listing was confirmed against live NYSE quotation data in August 2026, not assumed from the filing's date.
Scale. The feature file computes market capitalization of $11,812,860,000 — 261.0 million shares outstanding at the FY2025 balance-sheet date multiplied by the 31 July 2026 close of $45.26 (fit_features.market_cap.usd). Against the $10 billion line, that is 18.1% of headroom. Independent quotation data in early August 2026 put the figure at roughly $11.6 billion, consistent within a week's price movement.
That headroom is thin by the standard of the stock's own volatility. Holding the share count constant, the 2 June 2026 close of $83.79 implies $21.9 billion, and the 8 April 2025 close of $22.57 implies $5.9 billion. The scale test is cleared today; it has not been cleared continuously, and a 15% decline from here would put it back in question. The Dislocation tab carries the price anatomy.
Segments and Their Economics
Two reportable segments. Alumina holds the bauxite mines and the refining system; Aluminum holds the smelters, casthouses and most of the energy assets [9]. The two are vertically linked: Alcoa's own smelters were the largest single customer for its smelter-grade alumina in 2025, taking roughly 34% of total alumina shipments [10].
Source: FY2025 Form 10-K, Note E, Sales by product division; excludes the "Other" line (realized gains and losses on embedded derivatives designated as cash-flow hedges), which was negative $263 million in 2025 [11].
The economics of the two halves diverge violently and have inverted twice in three years. Alumina segment adjusted EBITDA ran $273 million in 2023, $1,408 million in 2024, and $882 million in 2025; Aluminum ran $461 million, $657 million, and $1,058 million over the same years [12]. In the first half of 2026 the Alumina segment turned loss-making — negative $40 million in 1Q26 and negative $96 million in 2Q26 — while Aluminum earned $694 million and $1,073 million [13].
Sources: FY2023–FY2025 from the FY2025 Form 10-K, Note E [14]; 1Q26 and 2Q26 from the 2Q 2026 earnings presentation [15]. Annual and quarterly figures are not additive across the axis.
That inversion is the single most useful orientation fact about this business. The Alumina segment carried $5,671 million of total assets at the end of 2025 against Aluminum's $6,151 million [16] — roughly half the asset base is currently earning nothing. Management wrote the Alumina reporting unit's goodwill down to zero in the fourth quarter of 2025, a $144 million charge attributed to falling alumina prices, higher capital spending on Australian mine moves and reclamation, and a higher discount rate [17].
Capacity, as of 31 December 2025: 11,653 thousand metric tonnes per year of consolidated alumina refining capacity across Australia, Brazil and Spain, of which 1,014 kmtpy sat idle, with the 2,190 kmtpy Kwinana refinery permanently closed in September 2025 [18]; and 2,645 kmtpy of consolidated smelting capacity across Australia, Brazil, Canada, Iceland, Norway, Spain and the United States, of which 196 kmtpy was idle [19].
Geography of Revenue and Assets
Source: FY2025 Form 10-K, Note E, Geographic Area Information. Third-party sales are reported by the country where the point of sale originated, not by customer destination: Canadian and much Australian and Brazilian output is invoiced in the United States, and Icelandic and Norwegian metal is invoiced in the Netherlands, so those three countries carry assets but no separately disclosed sales line. "Other" sales of $25 million and "Other" long-lived assets of $3 million are omitted [20].
The physical footprint is Australian and Brazilian first: $2,027 million and $1,467 million of the $6,700 million of long-lived assets, against $773 million in the United States [21]. This is a U.S.-listed company whose assets sit largely outside the United States.
Market Structure
This is the raw material for the year-10 durability question that Durability carries, so it is stated with the pages attached.
Alcoa is a leader of the non-Chinese industry, and the non-Chinese industry is not the market. The FY2025 10-K states it plainly: "We are the largest alumina producer outside of China and the largest supplier of third-party alumina outside of China" [22]. The same claim appears in the FY2021 10-K, so the position has held for at least four years [23]. The December 2024 investor day repeats it as the world's number-one alumina producer by volume outside China [24]. In primary aluminum, the February 2024 transaction deck placed the combined company among the top five global producers excluding China [25].
The qualifier does most of the work. China accounts for 85.5 million tonnes of 2025 smelter-grade alumina demand against 58.6 million tonnes for the rest of the world — 59% of the global total [26]. Of the 17.3 million tonnes of net global primary aluminum production growth between 2015 and 2025, 13.4 million tonnes was Chinese [27]. A leadership position in the 41% of the market that is not China does not confer pricing power over a globally traded commodity.
Named competitors, by product. In alumina: South32, Rio Tinto and Glencore, plus commodity traders and "a growing number of refineries in Asia (especially in China and Indonesia)" [28]. In third-party bauxite: Rio Tinto and multiple suppliers from Guinea, Australia and Brazil. In primary aluminum: the traders Glencore, Trafigura, Vitol, Mercuria and Gunvor, and the producers Emirates Global Aluminium, Norsk Hydro, Rio Tinto, Century Aluminum and Vedanta [29]. Alcoa's own filing also names the substitute set: steel, titanium, copper, carbon fibre, composites, plastic and glass [30].
Wood Mackenzie's ex-China rankings, reproduced in Alcoa's own deck, show the fragmentation directly: the top-20 ex-China bauxite mines run from 41.0 down to 3.0 million dry tonnes, and the top-20 ex-China alumina refineries from 6.2 down to 1.0 million tonnes, spread across forty separately named assets [31].
The structure that follows. Bauxite, alumina and primary aluminum are globally traded, physically fungible commodities priced off exchange and index quotes. That is a fragmented, price-taking structure — not a monopoly, duopoly or oligopoly, and it does not yield the pricing conviction the year-10 gate looks for. Alcoa's own risk disclosure describes an industry in which "the impact of non-market forces on global aluminum industry capacity, such as political instability or pressures or governmental policies in certain countries relating to employment, trade, the environment, or maintaining or further developing industry self-sufficiency, may affect overall supply and demand" [32].
The strongest fact pointing the other way is cost position. Alcoa's average alumina cost position sat in the first quartile of global production in 2025, as measured by CRU [33]. In a price-taking industry, a durable first-quartile cost position is the one form of advantage that survives, because it decides who is still producing at the bottom of the cycle. The same paragraph immediately qualifies it: lower Australian bauxite grades "could place our Alumina segment in the second quartile until new mine regions are accessed" [34], and those new regions cannot start before 2029 [35].
Entry Barriers, Capital Intensity, Operating History
Regulatory barriers exist, and they cut inward as much as outward. Alcoa's mining is subject to "extensive permitting and approval requirements" at federal, state and local level in every country where it operates [36]. In February 2026, Alcoa agreed with the Australian federal government to undertake a strategic assessment of all current and potential future mine areas other than Myara North and Holyoake, through the end of its existing mine lease in 2045 under the Environment Protection and Biodiversity Conservation Act; the government granted an 18-month national-interest exemption allowing mining to continue at Huntly and Willowdale while that assessment is completed, targeted for August 2027. Ministerial decisions on the next major mine regions, Myara North and Holyoake, are sought by the end of 2026, with mining there "no earlier than 2029" [37]. This is a real barrier to a new entrant building a bauxite-to-metal chain in a developed jurisdiction. It is also, on the present record, a live constraint on Alcoa's own ore quality and cost.
Trade policy is the other regulatory factor, and it is directional rather than protective of structure. The Section 232 tariff on certain Canadian aluminum imports went from 10% (with Canadian metal exempt) to 25% on 12 March 2025 and to 50% on 4 June 2025 [38]. The average Midwest premium rose 211% year over year in 2025 largely as a result [39]. That premium is a policy variable, not a structural one, and it can be reversed by the same instrument that created it.
Capital intensity is genuine. Gross properties, plants and equipment stood at $19,629 million at 31 December 2025 against $13,837 million of accumulated depreciation, depletion and amortisation, leaving $6,700 million net including $908 million of construction in progress [40]. Gross plant is 1.53 times FY2025 revenue, and the asset base is 70% depreciated. Capital expenditure was $618 million in 2025, $580 million in 2024 and $531 million in 2023 [41] — roughly 4.8% of revenue in 2025. The FY2026 outlook raises that to approximately $675 million of sustaining capital plus $75 million of return-seeking capital [42]. Gross historical cost of the asset base, at $19,629 million, sits well above the $11.8 billion the equity market currently assigns to the whole company. Capital intensity of this kind is a barrier to marginal Western entrants; it has not prevented 13.4 million tonnes of Chinese primary aluminum production growth in a decade [43].
Operating history is long. 1888 to the present under the Alcoa name and process [44]; nine and three-quarter years as the separately listed entity that owns these assets [45]. Revenue over that separate life has been cyclical, not declining: $9,318 million in 2016, a trough of $9,286 million in 2020, and $12,831 million in 2025, with no three-year high-single-digit decline streak in the record (fit_features.revenue_trajectory.three_year_hsd_decline is false).
The Pending South32 Acquisition
On 30 June 2026 Alcoa agreed to acquire South32's interests in Worsley Alumina, Hillside Aluminium, and the Brazilian alumina and aluminum assets for $3.1 billion in cash plus approximately 17.0 million Alcoa shares — $4.1 billion of consideration, an implied enterprise value of about $4.7 billion including assumed lease-related debt, plus a contingent value right of up to $750 million through 2030 linked to alumina and aluminum prices. The cash is backed by a $3.1 billion bridge commitment. South32 would take roughly 6% of Alcoa, and the deal is expected to close in the first half of 2027 [46].
The acquired assets generated $4.7 billion of CY2025 revenue and $0.9 billion of CY2025 EBITDA [47], putting the effective multiple at 5.2 to 6.1 times CY2025 EBITDA against Alcoa's own five-year average enterprise value to next-twelve-month EBITDA of 6.3 times [48].
Two consequences matter for this tab. First, it consolidates the ex-China alumina market: South32 is one of the three alumina competitors Alcoa names in its own 10-K [49], and Worsley sits second on the ex-China refinery ranking, directly behind Alunorte [50]. The concentration gain is within the 41% of the market that is not China, so it does not change who sets the price. Second, it adds shares and debt at the same time. Share count has already gone from 178 million (FY2023) to 214 million (FY2024, on the Alumina Limited acquisition) to 261 million (FY2025), a 7.0% five-year compound rate on the feature file's calculation (fit_features.share_count_trend), with 266.0 million average shares in 2Q26 [51] and another ~17 million to come on closing. That trajectory belongs to Self-Help, and it is stated here because the acquisition announcement is where it was set.
The Exclusion Screen — What the Corpus Settles Here
Auto OEM (X1) — no. Alcoa manufactures no vehicles. It sells commodity-grade and value-add ingot — t-bar, sow, standard ingot, foundry, billet, rod and slab — to external customers and traders, whose fabrication operations serve "the transportation, building and construction, packaging, wire, and other industrial markets" [52]. Transportation is one of at least five end markets and Alcoa sits two steps upstream of any automaker. The corpus does not disclose a revenue split by end market, so transportation exposure cannot be quantified from the filings; the exclusion is not triggered on any reading.
Consensus-saturated darling (X4) — no, on valuation and chart shape. The market capitalization of $11,813 million against FY2025 revenue of $12,831 million is 0.92 times sales. Alcoa's own deck puts its enterprise value at 4.9, 4.6, 7.8, 8.3 and 5.6 times next-twelve-month EBITDA in 2021 through 2025 [53]. Neither figure is in the neighbourhood the exclusion targets.
Source: exchange closing prices as reported; 2026 is the 31 July 2026 close. Intra-period extremes since the 1 November 2016 separation were $5.48 on 20 March 2020 and $95.06 on 24 March 2022.
The chart is a sawtooth, not a line from bottom-left to top-right. From the $23.00 close on the first day of separate trading to $45.26 on 31 July 2026 is a 96.8% price return over nine and three-quarter years, around 7.2% compounded, inside a range of $5.48 to $95.06. Within the last sixteen months alone the stock rose 271% from $22.57 on 8 April 2025 to $83.79 on 2 June 2026 and then fell 46% to $45.26 by 31 July 2026.
The fact that cuts against a clean X4 reading is coverage tone. As of early August 2026 the sell side remains constructive rather than capitulated: the rating split is seven buy, five hold and one underperform, and the twelve published twelve-month targets run from $49.70 to $80.00 around a $59.50 median against a $45.26 price. The revisions bracketing the 16 July 2026 second-quarter release moved both ways without a capitulation — Morgan Stanley to Equal-Weight at $53 and Bank of America to $51 in the week before it, Wells Fargo up to $72, and BMO holding Market Perform after it. Consensus forward free-cash-flow estimates in the feature file imply 7.4% on FY2026, 13.3% on FY2027 and 16.1% on FY2028 against the current market capitalization (fit_features.consensus_forward_yield). That is a sell side modelling a large cash-flow ramp, which is a different thing from a story-stock multiple — but it does mean the name is not one consensus has abandoned. Yield carries what those estimates are worth.
China dependence (S1) — a price dependence, not a revenue or asset dependence. On the disclosed record, direct exposure is zero on both measures the test names. China appears on no line of the geographic third-party sales table, whose smallest disclosed category is "Other" at $25 million, or 0.2% of revenue; and China holds none of the $6,700 million of long-lived assets, whose "Other" line is $3 million [54].
The measurement caveat is material and should not be buried: sales are reported by the country where the point of sale originated, not by customer destination [55], and the 10-K states that Alcoa meets customer demand in markets including China [56]. Alumina sold from Australia to a Chinese smelter through an Australian or U.S. selling entity would appear as Australian or U.S. revenue. Destination-basis China revenue is not disclosed anywhere in the corpus.
What is not in doubt is the price channel. China is 59% of world smelter-grade alumina demand [57], and Alcoa's own explanation of the 2025 alumina price decline — and of the $144 million goodwill write-off that followed it — is "a global supply surplus, largely due to refinery expansions in China and Indonesia" [58]. Average alumina prices fell 11% in 2025 while average aluminum prices rose 9% [59]. A company with no Chinese revenue and no Chinese assets nevertheless has half its asset base earning nothing because of Chinese capacity decisions. The sensitivity is real; it just does not run through the balance sheet.
What the Corpus Does Not Settle Here
Revenue by end market and by customer destination is not disclosed in any filing in this corpus, so neither transportation exposure nor destination-basis China exposure can be quantified. Customer concentration is likewise undisclosed beyond the statement that Alcoa's own smelters take roughly 34% of alumina shipments [60]. The feature file's adjusted free-cash-flow series is not_computable for every year because stock-based compensation is absent from the cash-flow feed, which is why no yield figure appears on this tab; Yield reports that limitation in full. The two exclusion checks this tab does not own — promotional-CEO pattern and structural decline — are carried by Self-Help and Durability, and nothing surfaced in the business record here that pre-empts either.
What happened to the price
Alcoa fell 46% in eight weeks — $83.79 on 2 June 2026 to $45.26 on 31 July — in three dated legs: an aluminum-price unwind through June, an 8.9% drop on the 30 June South32 acquisition, and a 6.1% drop on record second-quarter results that landed 3.2% short of consensus. Traded volume through the fall measures 1.23x its pre-peak median: repricing, not capitulation. Consensus earnings estimates were cut after the price moved, not before.
The drawdown, quantified
Peak close — 2 Jun 2026
Trough close — 29 Jul 2026
Latest close — 31 Jul 2026
Peak to latest
Source: daily closing prices, company price history as reported; the same series that feeds the deterministic capitulation gauge.
The deterministic feature file measures a different episode. Its capitulation_gauge.drawdown records a peak of $47.42 on 26 November 2024, a trough of $22.57 on 8 April 2025, a depth of 52.4% and 133 days from peak to trough, with the current close of $45.26 on 31 July 2026. Those figures are arithmetically correct and describe the tariff-era fall of 2024–25 — an episode that has since healed: at $45.26 the stock sits 4.6% below that November 2024 peak. The gauge appears to select the deepest fall in the price record rather than the live one, and the 2024–25 fall is 3.6 points deeper than the current one. The drawdown a buyer would be entering today is the June–July 2026 fall, computed here from the same daily price file, and it is the one this tab anatomises. The mismatch is recorded as a data gap.
Source: weekly closes drawn from the run's daily price history; the daily peak, trough and current levels reconcile to the deterministic capitulation gauge in fit_features.capitulation_gauge.drawdown. Prices as reported, not adjusted for the pending share issuance.
The chart shows two distinct falls with a 138% advance between them. From $35.26 on 4 November 2025 the stock rose to $83.79 on 2 June 2026 — 143 sessions — as Middle East supply disruption lifted the aluminum price; management put the smelting capacity offline inside the Strait of Hormuz at 3 to 3.5 million metric tons [1]. The fall that followed gave back that advance and rather more of it. On 261 million shares, market capitalisation went from $21.9 billion at the peak to $11.8 billion on 31 July — a fall of $10.1 billion. The 52-week range is $28.40 to $83.79, and the current price sits at 30% of that range.
The trigger
Four of the eight weeks carry an identifiable dated event; the rest is a one-way grind in the metal price.
Sources: closing prices from the run's daily price history; event column from the Form 8-K of 1 July 2026 [2] and the Q2 FY2026 earnings call of 16 July 2026 [3].
Leg one — the metal price, no filing. Between 2 and 30 June the stock lost 37.8% with no company filing of any kind. The explanation came six weeks later, from the company: the LME aluminum price "has returned to pre-Middle East conflict levels following a macro-driven correction" [4]. Asked directly why the price retreated when the disruption had not been resolved, the CEO answered: "The first answer is sentiment. The fundamentals from when the Iran conflict started have not fundamentally changed" — the 3 to 3.5 million tons of Strait of Hormuz capacity remained offline [5]. This leg is the largest of the five and the least company-specific. It is a commodity repricing that a shareholder experienced through the equity, not an event at Alcoa.
Leg two — the acquisition. On 30 June 2026 Alcoa entered an Umbrella Implementation Deed to acquire South32's interests in bauxite mining, alumina refining and aluminum smelting [6]. The upfront consideration is $3.1 billion of cash plus approximately 17 million Alcoa shares carrying an agreed value of about $1 billion — struck on the 10-day volume-weighted average price to 26 June of $58.79 — representing roughly 6% of shares outstanding after issuance, with up to a further $750 million payable in cash if alumina and aluminum prices exceed agreed strike prices over four annual periods [7]. The cash leg is backed by a committed senior unsecured 364-day bridge facility of up to $3.1 billion from a single commitment party, to be refinanced with senior unsecured notes before closing [8]. The market reaction on 1 July was a fall of 8.9% on 16.9 million shares, the heaviest session of the drawdown and the heaviest since 23 October 2025. A share-issuing, debt-funded acquisition that lifts the count by roughly 6% is directly relevant to the share-count test carried in Self-Help; at $45.26 the equity consideration struck at $58.79 is worth 23% less than its agreed value.
Leg three — the quarter. Q2 2026 revenue rose 24% sequentially to $3,966 million; the realised primary aluminum price rose from $4,209 to $4,752 per metric ton and adjusted EPS from $1.40 to $2.12 [9]. The CFO called that the highest quarterly revenue in Alcoa's almost ten-year history, and set against it a print "modestly below consensus," the variance driven by "lower-than-expected aluminum price realization late in the quarter, as LME prices declined sharply in the final two weeks of June" [10]. Adjusted EPS of $2.12 came in 3.2% under the $2.19 consensus. The same call lowered full-year alumina production guidance to 9.5–9.6 million metric tons and shipments to 11.5–11.6 million, raised full-year other corporate expense to about $180 million and depreciation to about $660 million [11]. The stock fell 6.1% the next session on 11.7 million shares.
Separating the event legs from the drift: of the $38.53 the stock lost between 2 June and 31 July, the two dated event days account for $7.53, or 19.5%. The undated June grind alone accounts for $31.65, or 82%, before the late-July rebound of $2.38. The framework's caution about a 10–20% slide on no event and normal volume does not map cleanly here, because the undated leg is 38% rather than 15% — but it remains true that four fifths of what happened to Alcoa's price happened to the aluminum price, not to Alcoa.
For orientation, the prior fall the feature file measures had a cleaner company-specific trigger: US Section 232 tariffs of 25% on aluminum imported from Canada took effect on 12 March 2025 and cost roughly $20 million in that quarter alone, before the April 2025 macro selloff took the stock to $22.57 [12].
The fear gauge
Source: daily traded volume from the run's price history, 1 June to 31 July 2026; the pre-peak benchmark is the 5.71 million-share median of the 180 calendar days before 2 June 2026. One non-session record dated Saturday 18 July is excluded as a feed artefact.
The deterministic gauge reports a volume spike multiple of 1.23x, defined as the maximum 20-day average volume in the peak-to-trough leg divided by the median daily volume over the 180 days before the peak (fit_features.capitulation_gauge.volume_spike). That figure is computed on the 2024–25 leg. Applying the identical definition to the live June–July 2026 leg gives 1.23x as well: a peak 20-day average of 7.02 million shares (10 June to 9 July) against a pre-peak median of 5.71 million. The two episodes are indistinguishable on this measure.
Individual sessions ran hotter than the 20-day average implies. The heaviest were 1 July at 16.9 million shares — 3.5x the trailing 50-day average — then 15 June at 12.4 million (2.8x) and 17 July at 11.7 million (2.1x). For scale, the ten largest volume days in Alcoa's recorded history run between 4.8x and 6.7x their trailing 50-day averages. No session in this drawdown reaches that band.
The tape has since gone quiet rather than climactic: 20-day average volume on 31 July was 5.20 million shares, below the 5.71 million median that prevailed before the fall began. On the framework's own test — volume must have spiked, peak fear rather than the start of the slide — a 1.23x measured multiple and a post-fall tape running below its pre-fall average describe orderly repricing by holders who could sell, not forced or exhausted selling. Whether the price is nonetheless wrong is a question for Damage Math and Yield; it is not answered by the volume.
Who was selling
The direct evidence is thin, and the thinness is itself a finding.
Short interest is unavailable for this run. Every file under data/short_interest/ is empty of rows; the collection manifest records that FINRA returned no reported short-interest rows for the ticker and that no position rows were staged. No level, no change, no days-to-cover can be stated. This is a gap, not a zero.
Insider transactions stop before the window. The Form 4 and 5 record assembled for this run runs from October 2016 to 27 January 2025 — 579 transactions, none inside the June–July 2026 fall. The last open-market sale on record is a $1.0 million disposal by the Chief Commercial Officer on 22 October 2024, at $42.29. No insider buying or selling into this drawdown can be confirmed or ruled out.
Holder-base filings pre-date the fall. The most recent beneficial-ownership filings are Vanguard Capital Management's Schedule 13G of 29 April 2026 (5.5%) and Allan Gray Australia's amendment of 17 February 2026 (4.7%). Both were filed before 2 June. Orbis Investment Management (6.2%) and Eagle Capital Management (5.98%) last filed in November 2024. Nothing in the corpus documents a holder change inside the drawdown.
The one documented structural seller is prospective, not historical. The acquisition creates a known future supply of stock: at least half of the roughly 17 million shares of consideration is to be distributed in specie to South32's shareholders, and the balance is saleable by South32 in an orderly manner [13]. The deed caps that selling at 20% of Alcoa's average daily trading volume on any one trading day for three months following completion [14]. Closing is expected in the first half of 2027 [15]. That overhang sits ahead of the stock, not behind it — it cannot explain the fall that has already happened, and it is a reason the supply picture over the next four quarters is known rather than unknown.
On the framework's distinction between forced or anchored sellers and informed ones, the honest answer for Alcoa is that the corpus does not identify who sold. What it does show is that the selling was absorbed at volumes barely above normal, which is more consistent with discretionary rotation out of a commodity equity whose commodity had fallen than with a liquidation.
Estimates versus price
Source: consensus revision history from the run's CapIQ estimates feed (data/sp/estimates.json, momentum series at 180-day, 90-day, 30-day and current as-of dates), paired with the last closing price on or before each as-of date from the run's daily price history.
Source: derived from the consensus revision history in the run's CapIQ estimates feed and the daily price history; index base 3 February 2026 = 100.
The sequence is unambiguous. Between 4 May and 2 July the price fell 22.1% while consensus FY2027 EPS rose 12.3%, from $6.70 to $7.52, and FY2028 EPS rose 24.0%. The cut came afterwards: in the month to 2 August, FY2027 EPS was marked down 21.1% to $5.93 and FY2028 down 15.7% to $7.04, while the price fell a further 7.0%. Over the full 90 days to 2 August the price is down 27.5%, FY2027 EPS down 11.4%, and FY2027 revenue up 1.4%; FY2028 EPS is 4.5% above where it stood 90 days ago.
Measured from before the spike began, the gap is wider still. On 3 February 2026 the stock closed at $61.35 with FY2027 consensus EPS at $5.23 — 11.7 times forward earnings. On 31 July it closed at $45.26 with FY2027 consensus at $5.93 — 7.6 times. Six months of falling price against rising estimates.
Two qualifications belong with that. First, consensus for a commodity producer two years out is a wide band, not a point: the eleven FY2027 EPS estimates run from $2.74 to $9.17 with a standard deviation of $1.78, so a 21% move in the mean is well inside the dispersion of the panel. Second, the sell side's price targets have not converged on the current quote — twelve targets average $62.98 with a median of $59.50 against a $45.26 close, and the recommendation split is seven buy, five hold, one underperform. Consensus forward free-cash-flow yields on the current $11.8 billion market capitalisation compute to 7.4% for FY2026, 13.3% for FY2027 and 16.1% for FY2028 (fit_features.consensus_forward_yield); what those figures mean against the framework's bar is the subject of Yield.
What the drawdown amounts to
There is a dislocation here, and it is dated. The stock lost 46% in eight weeks against two identifiable documents — the 30 June acquisition and the 16 July quarter — and one undated commodity leg that management itself calls sentiment-driven. On the framework's timing test, the price moved first and consensus followed: the price fell 22% while FY2027 estimates were still rising, and the eventual 21% estimate cut arrived a month after the fall was largely complete.
Two facts cut the other way and are not softened. The volume signature is not capitulation — 1.23x on the measured definition, no session above 3.5x its 50-day average, and a post-fall tape running below its pre-fall average. And a substantial part of what fell was a spike that had been built in seven months: at $45.26 the stock is still 28% above the $35.26 it traded at on 4 November 2025, before the Strait of Hormuz disruption lifted the metal. What that combination is worth — whether the June repricing destroyed intrinsic value proportionate to the $10.1 billion of market capitalisation it removed — is the arithmetic carried in Damage Math, and the temporary-or-permanent question is settled there, not here.
Damage Math
The market marked Alcoa down 46% — from an $83.79 war spike on 2 June 2026 to $45.26 on 31 July, about $10.1B of equity value. But the quarter it fell into was the highest-revenue quarter in the company's history, and near-term consensus earnings did not fall with the price: FY2027 EPS sits 21% below its 30-day peak yet 13% above its level of 180 days ago. The durable value damage is far smaller than the headline drawdown; roughly half the fall is the give-back of a two-week aluminum-price spike. The one genuinely impaired line is Alumina, and the trial rates it 66% likely to be temporary.
The near-term hit — what actually fell
The clean way to size the numerator is the consensus revision record around the trigger. Two things are true at once, and both matter.
Source: consensus estimate momentum, CapIQ vintages 3 Feb 2026 → 2 Aug 2026 (data/sp/estimates.json, momentum series).
Consensus FY2027 EPS ran from $5.23 (180 days ago) up to a $7.52 peak 30 days ago, then back to $5.93 — a 21% cut from the peak, but a $0.70 (13%) gain versus 180 days ago. FY2028 traces the same arc: $5.41 → $8.35 → $7.04, up 30% over 180 days despite the recent cut. The spike and the cut are the same event seen twice: analysts marked a war-driven aluminum deck up in late May and back down after the ceasefire. Revenue tells the same story — FY2027 consensus is $15.2B now versus $13.9B 180 days ago, up 9%.
Against a pre-spike window, the durable markdown is modest. FY2027 EPS fell from $6.70 (90 days ago, before the spike) to $5.93 — a $0.77, 11.5% reduction, or about $201M/yr of net income on 261M shares. That, not the 21% peak-to-trough figure, is the honest near-term hit.
The reported quarter confirms the scale. Q2 FY2026 normalized EPS came in at $2.12 against $2.19 consensus — a 3.2% miss — with revenue of $3.97B versus $4.16B (4.6% light). Management attributed the entire variance to timing: revenue rose 24% to "the highest quarterly revenue in Alcoa Corporation's almost 10-year history," adjusted EBITDA was $901M, and the shortfall "was driven by lower-than-expected aluminum price realization late in the quarter" under a 15-day pricing lag that "does not change the underlying strength of the business" [1].
The company's own guidance change was small and dated, not a reset of earning power. For Q3, the Alumina segment is guided "net favorable by approximately $10 million" on Pinjarra recovery and lower energy, but Alcoa "do[es] not expect to fully recover the production and shipment volumes that were lost" and raised its full-year corporate-expense outlook to "approximately $180 million" [2]. A ~$10M segment swing and a modest cost-guide raise are one- to two-quarter items, not a permanent level shift.
The price and EV move — over the same window
Price vs 2-Jun spike
Price vs pre-spike base
FY27 EPS vs 30d peak
FY27 EPS vs 180d ago
Source: daily closes (data/prices/daily.json); shares 261M and market cap $11.81B (fit_features.market_cap); consensus momentum (data/sp/estimates.json).
The market-cap arithmetic depends entirely on the anchor. From the $83.79 spike, equity fell from $21.9B to $11.8B — down $10.1B (46%). But the stock traded $62–65 through January–mid-May 2026, before the Middle East conflict lifted the aluminum deck; at that ~$64 base, market cap was $16.7B, so the durable fall is $4.9B (29%).
Source: daily closes, selected dates (data/prices/daily.json).
Enterprise value moves in step: net debt was about $0.84B at FY2025 (fit_features.balance_sheet_class), small against the equity, so EV of roughly $12.7B now compares to ~$22.7B at the spike. The pending South32/AliGroup acquisition — $3.1B cash plus ~17M shares, about 6% dilution, closing in H1 2027 [3] — will lift pro-forma EV but also add roughly half again as much alumina and a third more aluminum capacity, so it is flagged here rather than folded into the damage figure.
The NPV arithmetic — two scenarios, workings visible
The question is whether the price fall is warranted by the change in the value of all future cash flows. The transparent test: discount the durable annual earnings shortfall at a 10% cost of equity (a defensible rate for a price-taking, cyclical materials producer), under a temporary reading (the hit reverses after two years) and a permanent reading (a level shift held in perpetuity, no growth). Two shortfall anchors are shown — the peak-referenced cut ($1.59/sh × 261M ≈ $415M/yr) and the pre-spike durable cut ($0.77/sh × 261M ≈ $201M/yr).
Source: derived. Temporary = S × (1/1.10 + 1/1.10²); permanent = S / 0.10; S from consensus EPS revision (data/sp/estimates.json). Adding 2% growth to the permanent stream raises those figures by roughly a quarter.
Set the plausible value damage against the price damage:
Source: derived from price damage (fit_features.market_cap; data/prices/daily.json) and the NPV scenarios above.
The gap runs the same direction in every cell — the price fell more than a conservative reading of the durable hit destroys — but its size swings from $2.9B to $9.3B on the anchor choice, and the largest single contributor to the wide-gap cells is the war spike, not a fresh markdown of the business. On the most defensible pairing — the pre-spike base against a permanent reading of the durable hit — price damage of $4.9B exceeds value damage of about $2.0B, a gap near $2.9B (roughly 59% of the base-anchored drawdown). That is a real but moderate dislocation, not the two-thirds-cut-with-NPV-intact pattern of the framework's Centene precedent. The consensus check points the same way: forward FCF of $1.57B (FY2027) and $1.90B (FY2028) implies 13.3% and 16.1% yields on today's $11.8B cap, clearing the framework's 10% reference bar — the sell side is not underwriting a broken business, which the Yield tab develops against reported FCF that averaged only ~$208M a year across FY2021–FY2025.
The trial — temporary or permanent, presented fairly
The two readings were argued by opposing corpus-cited briefs and scored by three blind judges. Both cases carry real evidence.
The three judges put the probability that the impairment is temporary at 0.66 — the ruling this report carries. The per-judge estimates ranged 0.57 to 0.68 (mean 0.64), and the ruling was recorded as not contested, with order-stability gap of 0.035. The verdict is a lean toward temporary with a meaningful permanent tail — consistent with the arithmetic above, where price damage exceeds value damage but not by the clean multiple the framework's best setups show.
Which line broke — and whether it self-corrects
Consensus locates the break precisely. The Aluminum segment's realized price stayed elevated through the shock ($3,341/t FY2025 → $4,479/t FY2026), while the Alumina segment realized price reset from $418/t to $338/t and segment adjusted EBITDA swung from +$0.92B to −$0.31B.
Source: Visible Alpha consensus driver estimates (data/sp/va.json); Alumina segment EBITDA rounded to $M.
The mechanism cuts both ways, which is why the trial does not read 90/10. In favor of self-correction: alumina is Alcoa's own smelter input, so a lower alumina price lifts the Aluminum segment's margin; caustic and energy costs are normalizing; and Pinjarra has returned to stable operations [13]. Against it: consensus itself expects the Alumina segment to claw back only to about breakeven in FY2027 and roughly $245M by FY2028 — well short of the FY2025 $922M — because the China/Indonesia surplus is structural and the bauxite-grade remedy is gated to 2029 [14]. The aluminum half is a cyclical price recovery; the alumina half is a partial, slow, cost-side one. The Dislocation tab weighs whether this qualifies as peak-fear capitulation given the shape of the drawdown, and Durability tests the year-10 case on a price-taking commodity producer.
Bottom Line
Alcoa's adjusted free cash flow — reported FCF less stock compensation less the five-year average of acquisition spend — was $526M in FY2025: a 4.45% yield on an $11.81B market cap, against a three-year average of 0.16%. The balance sheet selects the framework's most forgiving reference line, 8–9%; FY2025 sits 355 bps below it. Consensus reaches that line only in FY2028, and the announced $3.1B South32 purchase reinstates a $620M annual deduction that takes it away again.
The Adjustment Line by Line
The framework's yield basis strips two things out of reported free cash flow: stock-based compensation, because it is a real cost paid in shares, and the trailing five-year average of acquisition spend, because serial buyers are not free to hand the cash to shareholders. For Alcoa the first deduction is small and the second, historically, is zero.
The deterministic feature file could not compute this series: fit_features.adjusted_fcf returns null for every year, with not_computable recording "missing SBC for FY 2016, 2017, 2018, 2019, 2020, 2021, 2022, 2023, 2024, 2025; no complete consecutive five-year acquisition window with SBC." The structured cash-flow feed carries operating cash flow and capital expenditures but no stock-compensation line. The table below therefore rebuilds the adjustment from the filed Statements of Consolidated Cash Flows, which disclose stock-based compensation directly for all seven years. Reported FCF matches fit_features.adjusted_fcf.series[].fcf exactly, year for year.
Adjusted FCF = reported FCF − SBC − 5-yr average acquisition spend; derived from company filings. Reported FCF and capital expenditures from the FY2025 Statement of Consolidated Cash Flow [1]; SBC for 2019–2021 from the FY2021 statement [2] and for 2021–2023 from the FY2023 statement [3].
Stock compensation runs $25M to $41M a year — under 8% of reported FCF in the good years, and immaterial to the answer [4]. The acquisition deduction is zero for a specific reason: there is no acquisitions line anywhere in Alcoa's investing activities from FY2016 through FY2025, and the one large deal in that decade — the August 2024 buy-in of Alumina Limited — was settled in stock, appearing as a $2,377M credit to additional capital rather than a cash outflow [5]. The zero is a fact about payment form, not about restraint. What the cash-flow statement did not charge, the share count did: 178M shares at the end of FY2023, 261M at FY2025, and 263,909,445 outstanding on July 27, 2026 [6]. That dilution lands in the denominator of every yield below, not in the numerator.
Source: derived from reported financials, FY2021, FY2023 and FY2025 Statements of Consolidated Cash Flow [7] [8] [9].
Yield on Three Bases
Market capitalisation is $11,812.86M — 261M shares at the $45.26 close of July 31, 2026 (fit_features.market_cap). Three readings follow from the same numerator series.
FY2025 Adjusted Yield
3-Year Average
7-Year Baseline Median
Adjusted FCF ÷ market capitalisation; derived from company filings and the $45.26 close of July 31, 2026. Numerator components from the FY2025 Statement of Consolidated Cash Flow [10].
Current. $526M ÷ $11,812.86M = 4.45%.
Three-year average. Adjusted FCF of −$475M, $6M and $526M across FY2023–FY2025 averages $19.0M, or 0.16%. Widening the window barely helps: the five-year average is $170.0M (1.44%) and the seven-year average $163.3M (1.38%). The single best adjusted-FCF year in seven is FY2025's $526M.
The company's own baseline. fit_features.yield_baseline is not_computable — the feature needs adjusted FCF, which it does not have. Applying the feature's own stated method (adjusted FCF ÷ same-year shares × last close on or before fiscal year-end) to the filed figures gives the series below.
Source: derived from reported financials and year-end closing prices; adjusted FCF per the table above [11].
The median of those seven years is 3.67%, with a range from −7.85% to 6.96%. Today's 4.45% is 1.21 times that median. The fortress signature the framework hunts — a stable 3.5–4% name repricing to 8–9% — requires roughly a doubling; Alcoa has not doubled off its baseline, and the baseline itself is not stable enough to be a baseline. Three of the seven years sit at or near zero.
That last point carries the P2 stability test directly. fit_features.fcf_stability is not_computable for the same missing-SBC reason; computed from the filed series, the rolling five-year average of adjusted FCF is $122M (FY2019–23), $68M (FY2020–24) and $170M (FY2021–25) — the average itself moves by a factor of 2.5 across three consecutive windows, a coefficient of variation of 0.35. The framework tolerates an occasional negative year every five to eight years as the price of 25–30% margins in the good ones. Alcoa's FY2023 was negative, and FY2020 and FY2024 rounded to nothing.
Which Bar Applies
fit_features.balance_sheet_class returns "unknown", with not_computable recording "EBITDA missing for FY 2025." It does supply net debt: $842M, which reconciles to the filed balance sheet as $2,438M of long-term debt plus $1M due within one year less $1,597M of cash [12]. Alcoa's disclosed profit measure is Total Segment Adjusted EBITDA, $1,940M in 2025 and $2,065M in 2024 [13]. Consensus EBITDA for the same year is $1,964.8M on nine estimates, 1.3% away, so the two definitions can be used interchangeably here.
The rule reads: fortress if net debt is nil or net debt / EBITDA is 0.5 or below; levered at 3.0 or above; moderate in between.
Net debt from fit_features.balance_sheet_class.net_debt, tied to the FY2025 balance sheet [14]; EBITDA from segment disclosure FY2025 [15] and FY2023 [16]; the post-acquisition figure is management's own stated ceiling [17].
On FY2025 figures Alcoa lands in the fortress band at 0.43 times, which selects the framework's lowest bar. That is the reading most favourable to the company, and it is the one used here. It is also cycle-dependent: run the same $842M against FY2023's $734M of segment EBITDA and the ratio is 1.15 times, squarely moderate [18]. And management has told the market where the post-deal balance sheet will sit: the cash portion of the South32 consideration was sized so as "not exceed a leverage ratio of 2.0x based on recent pricing" [19]. Two times is moderate, and moderate selects 10%.
Stated in plain arithmetic against the most forgiving line: 4.45% on FY2025 adjusted FCF against the 8% fortress bar — 355 bps short. Against the top of the fortress band at 9%, 455 bps short. Against the 10% default bar the post-deal balance sheet selects, 555 bps short. In dollars, the 8% line asks for $945M of adjusted FCF; FY2025 produced $526M, and the seven-year average produced $163M.
Mid-Cycle Normalization
Alcoa is a commodity cyclical, so the FY2025 figure needs testing against a normalized year. Total Segment Adjusted EBITDA over FY2019–FY2025 ran $1,626M, $1,317M, $3,053M, $2,280M, $734M, $2,065M and $1,940M [20] [21] [22]. The mean is $1,859M and the median $1,940M. FY2025's $1,940M is the median. On the profit line, FY2025 was a mid-cycle year, not a depressed one — which means the low yield is not a cycle artefact waiting to unwind.
The normalization therefore has to run through the cash bridge rather than through the profit line. Assumptions, stated so they can be re-run under alternates:
- Mid-cycle EBITDA $1,859M — the arithmetic mean of the seven years above. Using the median instead adds $81M.
- Unallocated costs −$308M — the three-year average of transformation, corporate expenses and other unallocated items ($268M in 2023 [23], $315M in 2024 and $342M in 2025 [24]).
- Intersegment eliminations +$30M — the seven-year average of a line that swings from −$231M to +$252M [25].
- Cash interest −$128M — the FY2025 amount paid, net of capitalisation [26].
- Cash taxes −$250M — between the $167M paid in FY2025 and the $319M paid in FY2023; Alcoa pays essentially no U.S. federal tax, with Australia the largest single jurisdiction [27].
- Capital expenditure −$750M — the company's own 2026 projection, of which $675M is sustaining [28].
- Legacy cash outflows −$203M — pension contributions of $20M plus the three-year average $183M reduction in noncurrent liabilities, the cash cost of asset-retirement, environmental and restructuring obligations [29].
- Working capital $0 — assumed neutral through the cycle. This assumption is generous, and the next section shows why.
- SBC −$37M — the three-year average.
Source: derived from reported financials, FY2019–FY2025 10-Ks; assumptions listed above [30] [31] [32] [33].
Mid-cycle adjusted FCF of $213M is 1.80% on today's market cap. A second route reaches the same place: reported FCF as a share of Total Segment Adjusted EBITDA across the six positive years averaged 14.3%, and $1,859M at 14.3% less $37M of SBC is $229M, or 1.94%. The seven-year realized average of $163M sits just below both, at 1.38%. Call the mid-cycle band 1.4% to 1.9%.
Run the bridge backwards and the requirement becomes concrete. An 8% yield needs $945M of adjusted FCF, which at the bridge's cost lines needs $2,592M of segment EBITDA. A 10% yield needs $1,181M, which needs $2,828M. Alcoa has cleared $2,592M once in the seven years above, in 2021.
The honest counter to that: it is clearing it right now. First-half 2026 Total Segment Adjusted EBITDA was $1,631M against $1,034M a year earlier, an annualized $3,262M [34]. The EBITDA level the bars require is reachable at current aluminum prices. What is not reachable, on the current evidence, is the cash conversion — see the next two sections.
Cash Conversion
Free cash flow as a share of revenue over the last decade: $1,542M of cumulative FCF on $113,972M of cumulative revenue, or 1.35%. Split in halves, FY2016–FY2020 converted at 0.93% and FY2021–FY2025 at 1.74% — an improvement, but both under 2%, and the year-to-year path tracks the aluminum price rather than any operating trend.
Source: derived from reported financials; revenue from the FY2025 segment reconciliation [35], cash flow from the FY2025 statement [36].
The binding constraint sits between EBITDA and cash, and the first half of 2026 shows it working in real time. Cash from operations was $429M against $563M a year earlier, on capital expenditure of $305M — free cash flow of $124M, or $94M after the $30M of stock compensation booked in the period [37]. That is a 7.6% conversion of the half's $1,631M of segment EBITDA, in the strongest six months of revenue in the company's history.
The cause is visible on the same page: receivables absorbed $440M, inventories $128M and payables $101M, $669M in total, driven by higher aluminum pricing [38]. The same pattern ran in FY2024, when receivables consumed $493M [39]. Alcoa's working capital is indexed to the metal price: the better the price, the more cash the balance sheet swallows on the way up. That is why 2021's $3,053M of EBITDA converted to $530M of FCF and a 4.34% yield on that year's market cap — the best profit year of the decade produced a yield barely half the fortress bar.
The counter-fact that matters: a working-capital build is a level effect, not a rate. If aluminum prices plateau rather than keep rising, receivables stop growing and conversion normalizes toward the bridge above. Management reported $422M of free cash flow in the second quarter alone and a $1.4B cash balance, with adjusted net debt of $1.4B inside its target range [40]. A flat-price second half would look materially better than the first.
The Acquisition Line
On June 30, 2026 Alcoa agreed to acquire South32's bauxite, alumina and aluminum interests for $3,100M of cash plus approximately 17 million shares valued at about $1,000M, with a ticking fee of 5% a year on the cash consideration and up to $750M of further cash contingent on alumina and aluminum prices over four annual periods [41]. Bridge financing of up to $3,100M was committed the same day [42]. Management estimates $80M to $100M of ticking fees payable at closing, partly offset by a locked-box mechanism it values at more than $200M as of June 30, and expects South32 shareholder approval in October or November [43].
The framework's acquisition deduction, dormant for a decade, switches on. A $3,100M cash purchase carries a trailing five-year average of $620M a year for the five years it sits in the window. Applied to the numbers already established:
Adjusted FCF = reported FCF − SBC − 5-yr average acquisition spend; derived from company filings, with the acquisition line set at $3,100M ÷ 5 per the announced terms [44]. Yields on the pro-forma market cap of $12,582M — 261M shares plus 17M issued, at $45.26.
The deduction is larger than the entire year of adjusted cash flow it is deducted from. It also raises the denominator: 17 million new shares, about 6% of the post-issuance count, take pro-forma market capitalisation to roughly $12,582M at the current price [45]. The capital-allocation reading of this — whether cash pointed at acquisitions can also be pointed at repurchases — belongs with the buyback record in Self-Help.
Two things cut the other way, and both are real. Management identified approximately $900M of net-present-value synergies with $50M of run-rate cost savings from the first year, and expects the deal to be accretive to earnings and cash flow immediately on closing [46]. And the acquired assets bring roughly 5.2 million tonnes of alumina and 900 thousand tonnes of aluminum capacity — a 53% and 37% pro-forma increase [47]. The framework's deduction charges the price without crediting the earnings it buys; a reader who thinks the assets are worth more than $3.1B should read the line as a timing charge rather than a permanent one. The closing conditions, including South32 shareholder and regulatory approval, are not yet satisfied [48].
The Consensus Check
fit_features.consensus_forward_yield draws on a direct free-cash-flow consensus from the vendor estimate file — not a proxy, though the count of contributing estimates is not disclosed for that item, unlike EBITDA (nine to ten estimates through FY2027, seven in FY2028) and revenue (twelve to thirteen through FY2027, nine in FY2028). Vintage: the estimate file was compiled on August 3, 2026, with per-metric momentum stamps dated August 2, 2026.
Source: consensus estimates per fit_features.consensus_forward_yield, compiled August 3, 2026; "as reported" yields on $11,812.86M, fully adjusted yields on the pro-forma $12,582M. Acquisition deduction of $620M per the announced terms [49].
Taken at face value, consensus clears both bars: 13.25% for FY2027 and 16.09% for FY2028. Subtract stock compensation and the picture barely moves. Subtract the acquisition line the framework requires, and FY2027 falls to 7.18% and FY2028 to 9.85% — below the 8% fortress line in the first year and 15 bps short of the 10% line the post-deal balance sheet selects in the second. On the framework's own basis, the sell side does not agree; it comes close in one year, four years out, and then recedes.
Three checks on the consensus itself, in fairness to both directions:
It was roughly right on the last completed year. The FY2025 consensus FCF of $533.8M compares with $567M actual — 6% light, not systematically optimistic.
It is running ahead of the current year. FY2026 consensus operating cash flow is $1,495M; the first half delivered $429M [50]. FY2026 consensus capital expenditure is $709M against the company's own $750M projection [51]. Hitting the $880M FCF mean requires $756M in the second half.
Its conversion assumptions have no precedent here. Consensus FCF as a share of consensus EBITDA runs 29.1% in FY2026, 49.8% in FY2027 and 63.6% in FY2028. Alcoa's realized conversion of FCF to Total Segment Adjusted EBITDA over FY2019–FY2025 was 18.9%, 3.1%, 17.4%, 15.0%, −59.9%, 2.0% and 29.2%. The FY2026 assumption matches the best year on record; the FY2027 and FY2028 assumptions are roughly double and quadruple it. Note that the FY2027 EBITDA estimates themselves span $2,221M to $4,428M across ten contributors, and the FY2028 mean of $2,989M sits below the FY2027 mean with a low of $1,818M — the dispersion is as wide as the forecast.
The mean-reversion underwrite
Consensus sits below the applicable bar in FY2026 on any adjustment basis, so the path back above it has to be written out rather than assumed.
The mechanism is price and volume, not cost. Aluminum realized $3,376 per tonne in 2025 against $2,841 in 2024 [52], and the Aluminum segment posted record quarterly EBITDA of $1.1B in Q2 2026 at a 32.3% margin [53]. The Alumina segment is the drag: it produced −$136M of EBITDA in the first half of 2026 [54], against $882M for the full year 2025 on an average realized alumina price of $415 per tonne [55]. Alumina recovery plus the acquired capacity is the whole of the step-up consensus is underwriting.
What consensus would have to concede to be wrong: that a step-up in EBITDA does not carry through to cash at 50–64%, because working capital, $750M of capital expenditure, $250M-plus of cash taxes and roughly $200M a year of legacy pension, asset-retirement and environmental outflows stand in the way — as they did in 2021, when $3,053M of EBITDA became $530M of free cash flow.
Probability. On the post-acquisition basis — the 10% bar, $1,258M of adjusted FCF required on a $12,582M pro-forma market cap — the estimate here is roughly 15% (range 10–20%) that Alcoa clears it in any single year of FY2027–FY2029. The basis: consensus at its FY2028 mean produces $1,240M, already 15 bps short, and to clear requires FCF above $1,919M in a year whose EBITDA estimates span $1,818M to $3,793M across seven contributors; Alcoa's highest reported FCF in ten fiscal years is $819M, in 2017. If the transaction does not close, the fortress line applies and the deduction does not, and the probability rises to roughly 30%: the FY2027 consensus of $1,524M after SBC clears $945M comfortably, but still asks for nearly double the best free-cash-flow year in company history.
What would change this read, in either direction: two consecutive halves in which EBITDA-to-FCF conversion holds above 30% with prices flat; the Alumina segment returning to a positive EBITDA run rate near its 2025 level; or capital expenditure settling below the $675M sustaining figure. In the other direction, a second year of working-capital absorption at the H1 2026 rate, or the contingent $750M becoming payable, would push the fully adjusted yield further from both lines. Whether the fall in price that produced today's entry point reflects damage of the same size is settled in Damage Math.
Durability
Alcoa clears one of the framework's five conviction sources — capital intensity — and fails or only partly meets the other four. It produced 3.1 percent of the world's primary aluminum and 6.4 percent of its alumina in 2025, at prices it does not set [1]. Physical output of alumina is down 27 percent in nine years, and the segment sold below cash cost in the first half of 2026 [2].
Cumulative FCF, FY2016–FY2025 ($M)
Alumina Output, FY2016 to FY2025
FY2025 Revenue vs FY2011 Carve-Out
Sources: derived from the FY2025 Form 10-K Statement of Consolidated Cash Flow and Statement of Consolidated Operations [3] [4], the FY2025 alumina production table [5], and the 2017 Form S-1 selected historical combined data [6].
Conviction Sources
The framework builds year-10 conviction from five specific places. Graded against Alcoa's own record rather than against the aluminum industry in the abstract, one of the five holds cleanly.
Sources: FY2025 Form 10-K, Item 1 Business — Competition [7] and Item 1A Risk Factors [8] [9]; Aluminum Corporation of China FY2025 Annual Report [10] [11]; Q2 2026 earnings presentation [12]; Q4 2025 earnings call [13]; Form S-1A [14].
Market structure. The Business tab establishes what Alcoa does; what matters for year-10 conviction is what share it holds and whether that share is stable. World primary aluminum output was 74.52 million tonnes in 2025, of which China produced 44.23 million — 59.4 percent [15]. World alumina output was 150.49 million tonnes, of which China produced 92.94 million — 61.8 percent [16]. Against those denominators Alcoa's 2,319 kmt of aluminum and 9,640 kmt of alumina work out to 3.1 percent and 6.4 percent of world supply [17] [18]. This is not a monopoly, a duopoly, or an oligopoly.
The strongest version of the opposite case is regional, and Alcoa states it: it is "the largest alumina producer outside of China and the largest supplier of third-party alumina outside of China," with a first-quartile cost position on the global alumina curve in 2025 [19]. On the ex-China denominator (57.55 million tonnes), Alcoa's 9,640 kmt is 16.8 percent — a real position. But the alumina market is not segmented: China exported 2.55 million tonnes in 2025, up 42.5 percent, and net-exported 1.35 million [20]. A regional leadership share that prices off a global index is a cost advantage, not a market structure.
Share has also moved the wrong way. Alcoa's alumina output was 7.1 percent of world supply in 2024 (10,034 of 141,570 kmt) [21] and 6.4 percent in 2025 — the denominator grew 6.0 percent while Alcoa's numerator fell 3.9 percent [22].
Regulatory entry barriers. In the framework's canonical form — a regulator that will not let a garage startup take share — no such regime protects Alcoa. The regulatory regimes that bind here run in the opposite direction: Alcoa's Western Australian bauxite mining requires state and federal environmental approvals it does not yet hold for its next major mine regions [23]. Trade policy is a genuine tailwind, and a reversible one: the Section 232 tariff on Canadian aluminum went from exempt to 25 percent in March 2025 and to 50 percent in June 2025 [24]. Tariff regimes set by proclamation are not entry barriers in the sense the framework means; they are policy positions with a ten-year half-life at best.
Capital intensity. This is where Alcoa's case is strongest and it is genuinely strong. Building a smelter costs $7,500 to $9,100 per tonne of annual capacity in North America or Europe, $4,500 in the Middle East, $2,100 in Indonesia or India, and $1,150 in China [25].
Source: Q2 2026 earnings presentation, expansion capex intensity slide; the North America and Europe bar plots the $7,500–$9,100 range at its midpoint [26].
Management's own behaviour confirms the barrier. Asked in January 2026 about greenfield expansion, the CEO said Alcoa has no greenfield plans for aluminum and has "not found anywhere around the world that provides a sufficiently low energy price for sufficient returns on a greenfield plant," with refining in a similar position [27]. That protects the incumbent asset base. It also says the incumbent cannot profitably grow it, which is the same fact seen from the other side.
Essentialness. Aluminum is essential and its demand is growing: management expects primary aluminum demand outside China to rise by roughly 7 million tonnes and alumina demand by roughly 18 million tonnes over the next decade [28]. What does not follow is that Alcoa's revenue is defensive. Revenue fell 22.2 percent in FY2019 and another 11.0 percent in FY2020, and 15.3 percent in FY2023 — with volumes broadly intact each time. The 10-K is explicit that demand for aluminum "is also highly correlated to economic growth" and that profitability "is subject to significant fluctuation" [29]. The metal is essential to the customer; the revenue line is not defensive for the shareholder.
Operating history. The Alcoa name reaches back to 1888 and the predecessor "pioneered the aluminum industry over 128 years ago" [30]. Alcoa Corporation, the entity being underwritten, became an independent public company on November 1, 2016 [31]. Its capital structure, portfolio, and management are nine years old and have been through one commodity cycle. The framework's 30-to-50-year test is met by the assets and the metallurgy, not by the security.
The Shrinking Physical Base
Revenue rose 37.7 percent between FY2016 and FY2025 while the physical base shrank. Alumina production fell from 13,251 kmt to 9,640 kmt, down 27.3 percent; bauxite from 45.0 to 37.5 million dry metric tons, down 16.7 percent; primary aluminum production was roughly flat at 2,368 to 2,319 kmt, while total aluminum shipments fell from 2,953 to 2,522 kmt.
Source: reported segment production data for the full FY2016–FY2025 series, of which FY2016–FY2019 and FY2022 come from 10-Ks not held in this corpus; FY2020–FY2021 alumina production per the FY2021 Form 10-K segment table [32] and FY2024–FY2025 per the FY2025 Form 10-K segment tables [33] [34].
Capacity tells the same story with less noise. Consolidated smelting capacity was 3,401,000 metric tons per year at December 31, 2015 [35], 2,962,000 at the end of 2021 [36], and 2,645,000 at the end of 2025, of which 196,000 sat idle [37]. That is 22 percent of smelting capacity retired in a decade. Refining capacity fell from 13,843 kmt at the start of 2025 [38] to 11,653 kmt at its end, when the Kwinana refinery — fully curtailed since June 2024 — was permanently closed, taking $856 million of restructuring charges and leaving roughly $525 million of cash outlays to run through 2031 [39].
Nine years of revenue growth on a shrinking asset base means the growth came from price. Alcoa's realized third-party aluminum price was $3,376 per tonne in FY2025 against $2,841 in FY2024 [40]; the same measure on the pre-separation carve-out was $2,669 in 2011 [41]. Fourteen years for a 26 percent nominal price gain, before any allowance for input-cost inflation over the same span.
Structural Threats
The alumina cost curve is inverting under Alcoa. This is the named, quantified threat, and it is live rather than prospective. Alcoa's Alumina segment realized $472 per tonne in FY2024 and $415 in FY2025 against adjusted operating costs of $309 and $317 [42]. In the six months to June 30, 2026 it realized $329 against a cost of $352 — production sold below cash cost — and the segment posted adjusted EBITDA of negative $136 million against positive $803 million a year earlier, with the Alumina Price Index down 38 percent year on year [43].
Sources: FY2025 Form 10-K segment table [44]; Q2 FY2026 Form 10-Q segment table [45].
The cause is supply, not demand. Alcoa attributes the decline to "refinery expansions in China and Indonesia" and recorded a $144 million goodwill impairment in Q4 2025 that took the Alumina reporting unit's goodwill to zero, citing declining alumina prices, higher capital expenditure on Australian mine moves and reclamation, and a higher discount rate [46]. Writing a reporting unit's goodwill to zero is management's own statement that the long-run value of that unit fell, and the Alumina segment is 11,653 kmt of the group's capacity against 2,645 kmt of smelting [47].
Sizing it for year 10: at FY2025 volumes of roughly 9,650 kmt of produced alumina shipments, each $50 per tonne of sustained margin compression is about $480 million of annual EBITDA. The move from FY2024's $163 per tonne spread to 1H FY2026's negative $23 is a $186 per tonne swing — on the order of $1.8 billion annualised — against FY2025 group adjusted EBITDA contributions of $882 million from Alumina and $1,058 million from Aluminum [48] [49]. A commodity whose price can move a segment's entire earnings contribution inside eighteen months is not a base from which a year-10 floor can be underwritten.
Bauxite quality and the Australian approvals. Alcoa's Australian refineries run on lower-grade bauxite than they were designed for, which "has caused increased production costs," and the company expects grades to stay at recent levels because mining in the next major mine regions — Myara North and Holyoake — will begin "no earlier than 2029" [50]. The 10-K states plainly that the grade issue could move the Alumina segment from the first to the second cost quartile until new mine regions are accessed [51]. Alcoa operates under a federal national-interest exemption granted for 18 months while a strategic assessment covering its mine lease to 2045 is completed by August 2027, and under a state exemption pending the WA EPA assessment [52]. Management says delays through the first half of 2027 are not expected to materially affect bauxite supply, quality, or operating costs, and that longer delays could be mitigated by modifying mining activities and refinery operating rates [53]. The exposure is that the cost position of the group's largest segment depends on a permitting outcome that is not in the company's control and that, at best, resolves the grade problem three years from now.
Section 45X expiry. The advanced-manufacturing credit contributed $63 million to FY2025 cost of goods sold at the Massena West and Warrick smelters. The One Big Beautiful Bill Act, enacted July 4, 2025, phases the credit out from 2031 and eliminates it entirely from 2034 [54]. That is a legislated, dated withdrawal of roughly 6 percent of FY2025 Aluminum segment adjusted EBITDA, landing inside the year-10 window.
Substitution and technology. Alcoa names steel, titanium, plastics, composites, ceramics, and glass as competing materials whose use "could reduce the demand for aluminum products" [55]. On the evidence in this corpus, material substitution runs toward aluminum rather than away from it over the next decade, so this is not where the year-10 risk sits. The technology question is inert-anode smelting: Alcoa's ELYSIS joint venture with Rio Tinto holds the patents [56], and management says the earliest Alcoa implementation is after 2030 [57]. Alcoa co-owns that development rather than facing it. On the framework's "your margin is my opportunity" test, no software or platform business can take share in bauxite mining or smelting; what defends the margin is the cost of building the physical plant, and nothing else.
Customer concentration — checked, and absent. Alcoa's 10-K discloses no single-customer dependence; its largest alumina customer is its own smelter system, at roughly 34 percent of total alumina shipments — 4,471 kmt of intersegment shipments against 13,300 kmt shipped in all [58]. The contrast in the peer set is instructive: Century Aluminum derived 54.0 percent of consolidated net sales from Glencore in 2025 [59]. Concentration is a genuine threat for parts of this industry; it is not one for Alcoa.
China dependence — checked. Alcoa is US-listed and US-incorporated with no Chinese revenue dependence disclosed. The China exposure here is structural and runs through price, not through customers: Chinese policy on capacity limits and environmental enforcement sets 59 to 62 percent of world supply in both products [60] [61].
The Disqualifier Check
The framework's numeric disqualifier is revenue declining high-single-digit for three consecutive fiscal years. It does not fire. fit_features.revenue_trajectory records consecutive_decline_years: 0 and three_year_hsd_decline: false.
Source: fit_features.revenue_trajectory, tied to the FY2025 Form 10-K Statement of Consolidated Operations [62].
The declines are severe but never consecutive past two years: −22.2 percent in FY2019, −11.0 percent in FY2020, then +30.9 percent in FY2021; −15.3 percent in FY2023, then +12.7 percent and +7.9 percent. Year-on-year change ranges from −22.2 to +30.9 percent across nine transitions, a 53-point spread around a mean of 5.1 percent.
The longer record, on the S-1's pre-separation carve-out basis, reads: $14,709 million in 2011, $13,060 million in 2012, $12,573 million in 2013, $13,147 million in 2014, $11,199 million in 2015 [63]. FY2025 revenue of $12,831 million is 12.8 percent below the 2011 figure. Two things are true at once and both belong on the page: the framework's specific structural-decline test is not met, and fifteen years of record show a sawtooth around a flat-to-falling line rather than a growing business.
Cash Flow Consistency
The framework's consistency test runs on adjusted FCF — reported FCF less stock-based compensation less the five-year average of acquisition spend. That series is not computable here. fit_features.not_computable records adjusted_fcf: missing SBC for FY 2016, 2017, 2018, 2019, 2020, 2021, 2022, 2023, 2024, 2025; no complete consecutive five-year acquisition window with SBC, and fcf_stability: fewer than five consecutive adjusted-FCF years. The rolling five-year average of adjusted FCF, the coefficient of variation, and the negative-year list are all absent from the feature file, and this tab does not improvise them.
What can be shown is the reported FCF series the feature file does carry, with its rolling five-year average computed here and labelled as such.
Source: reported FCF per fit_features.adjusted_fcf.series[].fcf, tied to the FY2025 Form 10-K Statement of Consolidated Cash Flow [64]; the rolling five-year average is derived here and is not the framework's adjusted-FCF series, which is not computable.
The rolling five-year average of reported FCF runs $100.2 million (FY2016–20), $349.2 million, $253.8 million, $156.0 million, $103.0 million, and $208.2 million (FY2021–25) — a mean of $195.1 million with a standard deviation of $87.9 million, a coefficient of variation of 0.45. The framework tolerates volatile annual FCF and rejects unpredictable five-year averages; a 45 percent coefficient of variation on the smoothed series is the second thing, not the first.
The negative years are FY2016 (−$715 million) and FY2023 (−$440 million). Neither is business-model-inherent in the sense the framework accepts. An insurer's underwriting cycle produces a loss year because premiums are collected before claims are known and the pricing corrects; the mechanism is identifiable and the cadence is 5 to 8 years. Alcoa's negative years are price years — FY2023 combined a 15.3 percent revenue decline with $531 million of capex [65], and the segment record shows Alumina adjusted EBITDA falling to $273 million from $788 million [66]. There is no repricing mechanism that restores the margin on a schedule, because Alcoa does not set the price.
Two structural drags sit between EBITDA and free cash flow for the whole of the year-10 window. Asset retirement obligations stood at $1,405 million at December 31, 2025, with $285 million of cash outflows scheduled for 2026 and $914 million for 2027–2030 [67]. Environmental remediation reserves stood at $282 million [68]. That is roughly $1.2 billion of legacy closure cash committed over the next five years, against ten-year cumulative reported FCF of $1,542 million [69].
Stock-based compensation, the first adjustment the framework applies, is small and disclosed for the recent years: $35 million in 2023, $36 million in 2024, and $41 million in 2025 [70]. Cash acquisition spend has been immaterial through FY2025 — the August 2024 Alumina Limited transaction was settled in stock. On those two adjustments alone, FY2025 adjusted FCF would compute to roughly $520 million against reported $567 million. That is an illustration, not the feature file's number, and the earlier years cannot be built the same way.
The Year-10 Case
The case that year-10 revenue and adjusted FCF are higher. Aluminum's supply side has genuinely tightened. China's operating electrolytic aluminum capacity reached 44.83 million tonnes per year at the end of 2025, "basically hitting the ceiling," with an increase of only 270,000 tonnes over the year [71]. Ex-China demand is expected to grow by roughly 7 million tonnes of aluminum and 18 million tonnes of alumina over the next decade while new supply is expensive to build [72]. Alcoa's Aluminum segment delivered record adjusted EBITDA of $1,073 million in Q2 2026 at a 32 percent margin, on an LME averaging $3,585 per tonne and rising regional premiums [73]. And Alcoa is adding scale rather than losing it: the June 30, 2026 agreement to acquire South32's upstream assets adds roughly 5.2 million tonnes of alumina capacity, a 53 percent increase, and roughly 900,000 tonnes of aluminum capacity, a 37 percent increase, at a valuation management describes as well below replacement cost [74] [75]. On volume arithmetic alone, a 2036 revenue line above 2025's $12,831 million is more likely than not.
The case against. Every element of that argument is a price forecast or an acquisition that has not closed. The consideration is $3,100 million of cash plus approximately 17 million Alcoa shares valued at about $1,000 million, plus a ticking fee at 5 percent per annum on the cash and up to $750 million of contingent payments over four years, funded initially by a $3,100 million bridge, with closing expected in the first half of 2027 [76]. Under the framework's own definition of adjusted FCF, $3,100 million of cash acquisition spend enters the five-year average at $620 million a year for 2027 through 2031. Alcoa's average reported FCF over FY2021–FY2025 was $208 million a year; it has cleared $620 million once in ten years, in FY2017. Adding roughly $40 million of SBC, reported FCF would need to run above roughly $660 million a year through 2031 simply for the framework's adjusted FCF to stay positive — before the acquired assets' own contribution, which the corpus does not disclose on a stand-alone basis.
On the revenue leg, the doubt is not about aluminum; it is about who captures the value. Alcoa is a 3.1 percent producer of a commodity priced daily on the LME and a 6.4 percent producer of one priced off an index it publishes but does not influence [77]. The larger segment by capacity is currently selling below cash cost, its goodwill has been written to zero, and the fix for its cost position is a mining approval that produces no ore before 2029 [78] [79] [80]. Fifteen years of history show revenue 12.8 percent lower than 2011 and cumulative free cash flow of $1,542 million against a market capitalization near $11.8 billion.
The read. The gate is not met. The framework asks for very high conviction that both year-10 revenue and year-10 adjusted FCF exceed today's, and treats any proper doubt as failure; here the doubt is specific and quantified rather than atmospheric — the larger segment is selling below cash cost today, its cost fix is a permitting outcome no earlier than 2029, and the framework's own adjusted-FCF definition would carry a $620 million annual acquisition charge from 2027 against a five-year average reported FCF of $208 million. The strongest fact against this read sits directly alongside it: China's production ceiling is binding, ex-China aluminum demand is expected to grow 7 million tonnes over the decade, greenfield capacity in the West costs seven times what it costs in China, and Alcoa's Aluminum segment has just printed its best quarter — so a higher 2036 revenue line is entirely plausible. The framework does not accept plausible in place of very high conviction, which is what separates this from a judgement about whether the shares are cheap.
What would change this read: a sustained recovery in the Alumina Price Index that restores the segment's spread above $100 per tonne for four consecutive quarters, ministerial approval of the Myara North and Holyoake mine regions on the 2026 timetable, and post-close disclosure showing the acquired assets generating free cash flow above the $620 million annual acquisition charge. The framework's own falsifier applies in reverse: three consecutive years of revenue decline, or FCF and EBITDA sliding from here, would remove the remaining ambiguity. On the balance sheet and repurchase mechanics that determine whether any of this reaches per-share value, see Self-Help; on the yield the current price implies, see Yield.
Bottom Line
Alcoa can comfortably outlast the problem: $1.6B of cash, an undrawn $1.25B revolver, and — after the May 2026 redemption — no bond maturity until 2029. What it is not doing is buying stock. Zero shares repurchased in 2023, 2024, 2025 and the first half of 2026, with $500M authorized and untouched since July 2022, while the share count went from 178M to 264M on stock-funded acquisitions.
Debt Maturities and Liquidity
The maturity schedule is the least of Alcoa's problems. Note M of the FY2025 Form 10-K states the principal maturing in each of the next five years directly: $1M in 2026, nothing in 2027, $219M in 2028, $500M in 2029 and $500M in 2030 [1]. Beyond that window the long-term debt table shows $750M of 7.125% notes due 2031 and $500M of 6.375% notes due 2032 [2]. Total principal is $2,470M, carried at $2,439M after $31M of unamortized discounts and financing costs, plus $9M of short-term borrowings tied to inventory repurchase agreements [3].
Year-by-year principal from the FY2025 debt footnote — the five-year schedule and the note-by-note table [4]; the 2028 tranche was redeemed at par on 15 May 2026 [5]. The 2026 column excludes $9M of short-term borrowings.
Source: FY2025 Note M debt footnote [6], adjusted for the 2028 note redemption reported on the Q2 FY2026 call [7].
Against that ladder sits $1,597M of cash and cash equivalents at 31 December 2025, of which $1,449M was held by foreign subsidiaries [8], a $1,250M revolving credit facility maturing June 2027 with no borrowings outstanding at either 2025 or 2024 year-end and none drawn during 2023, 2024 or 2025 [9], and a $200M Japanese yen facility, also undrawn [10]. Roughly $3.0B of liquidity against a nearest-term principal payment of $1M. Management's own framing on the Q4 FY2025 call was that "it all starts with a rock-solid balance sheet" [11].
Two financial covenants bind under the revolver: a minimum interest coverage ratio of 4.00 to 1.00, which reverted to that level on 1 January 2025 after a temporary reduction to 3.00 to 1.00 for fiscal 2024, and a debt-to-capitalization ratio not to exceed .60 to 1.00 [12]. Neither is close. FY2025 interest expense of $158M against $1,940M of total segment adjusted EBITDA is roughly 12x coverage [13]. Total debt of $2,448M against total equity of $6,118M on the year-end balance sheet [14] puts debt-to-capitalization near 0.29. The company reported compliance with all financial covenants at 31 December 2025 [15]. The January 2024 amendment did cost something: the facility is now secured by a first-priority interest in substantially all assets of the company and its material subsidiaries, releasable only on reaching two investment-grade ratings [16].
One covenant fact matters more than the rest for this tab. The bond indentures are deliberately loose on shareholder returns: they "do not include a limitation on restricted payments, such as repurchases of common stock and dividends to stockholders" [17]. Nothing in the debt documents stops Alcoa from buying its own stock. The constraint, where there is one, is a choice.
The deterministic feature file records net debt of $842M — long-term debt of $2,439M less $1,597M of cash — but returns balance_sheet_class: "unknown" because FY2025 EBITDA is absent from the structured feed. On the filed figures the ratio is $842M against $1,940M of FY2025 total segment adjusted EBITDA [18], about 0.43x, inside the framework's fortress boundary of 0.5x; the Yield tab reaches the same classification and applies the 8–9% reference line accordingly. Management's own measure, adjusted net debt, finished 2025 at $1.5B — "reaching the high end of our target range of $1 billion to $1.5 billion" [19] — and $1.4B at 30 June 2026 [20].
That is the position before the South32 transaction. On 30 June 2026 Alcoa signed an Umbrella Implementation Deed to acquire South32's bauxite, alumina and aluminum interests for $3,100M of cash plus roughly 17 million shares valued at approximately $1,000M, a ticking fee of 5% per annum on the cash consideration from South32 shareholder approval to closing, and up to $750M of contingent payments over four annual periods [21]. The cash leg is backed by commitments for a $3,100M senior unsecured 364-day bridge term loan, which the company intends to replace with permanent financing before closing, expected in the first half of 2027 [22]. Management set the cash portion "to a level that allows us to limit debt and not exceed a leverage ratio of 2.0x based on recent pricing" [23].
So the answer on duration is yes and the answer on headroom is qualified. The company can outlast a multi-year aluminum trough without a forced refinancing. But the allocation headroom that would let it repurchase stock into that trough has been spoken for: a fortress-class balance sheet is being converted into a roughly 2.0x-levered one, and the de-levering that follows will occupy the cash flows of the years when repurchases would matter most.
The Repurchase Record
Executed, not authorized. Across ten fiscal years the cash-flow statements record three repurchase years and seven zeroes.
Sources: FY2025 Statement of Consolidated Cash Flow for 2023–2025, which carries no repurchase line at all [24]; FY2022 Statement of Consolidated Cash Flows for 2020–2022 [25]; dividend totals from Note N [26]. The $50M repurchased in 2018 is fit_features.share_count_trend.buyback_cash_per_year; the FY2021 Form 10-K records no shares repurchased in 2019 or 2020 and dates the first authorization to October 2018 [27].
Total cash spent on repurchases since the 2016 separation is $700M: $150M in 2021 and $500M in 2022 [28], plus $50M in 2018 (fit_features.share_count_trend.buyback_cash_per_year) under the October 2018 authorization that the 2021 purchase exhausted [29]. That is 5.9% of the current $11.81B market capitalization, spread over a decade. Since then the record is a flat line. Note N states it without qualification: "No shares were repurchased in 2025, 2024, or 2023" [30]. The first half of 2026 extends it: the interim cash-flow statement shows dividends of $53M and no repurchase line [31].
The authorization is the counter-fact and it is a real one. The July 2022 board authorization for $500M has never been drawn on, and Alcoa restates each year that it "is currently authorized to repurchase up to a total of $500, in the aggregate" [32]. At $45.26 that authorization would retire about 11.0 million shares, 4.2% of the count. The capacity exists on paper, the indentures permit it, and four consecutive years have passed without a share bought.
Prices paid deserve their own line, because they run the wrong way. The 2021 tranche took 3,184,300 shares at a weighted average of $46.95 [33]. The 2022 tranche took 8,565,200 shares for $500M — an average of $58.38 [34]. Blended across both, Alcoa paid about $55.32 a share, 22% above the 31 July 2026 close of $45.26 and roughly 2.4 times the 8 April 2025 trough of $22.57 (fit_features.capitulation_gauge.drawdown). The buying happened at the top of the last cycle and stopped before the bottom of this one. Nothing in the record shows a company that repurchases counter-cyclically.
Share Count
Source: fit_features.share_count_trend.per_year, derived from reported financials; year-end shares outstanding of 263,102,406 at 31 December 2025 are stated in Note N [35].
From 183M in FY2016 to 178M in FY2023, Alcoa retired a net 2.7% of its shares over seven years — slow, but the right direction. Then the line breaks. FY2024 averages 214M and FY2025 averages 261M, a 46.6% increase in two years; fit_features.share_count_trend records rising: true and a five-year compound rate of 7.0%. The count outstanding was 263,102,406 at 31 December 2025 [36] and 263,909,445 on 27 July 2026 [37].
The driver is not stock compensation. Alcoa issued 699,509 shares under its employee plans in 2025, 1,116,022 in 2024 and 1,503,373 in 2023 — under 0.3% of the base in the latest year [38]. The driver is acquisitions settled in stock. Alumina Limited shareholders received 78,772,422 common shares plus 4,041,989 convertible preferred shares that converted to common in the fourth quarter of 2025 [39] — 82.8 million shares, a 46% expansion of the pre-deal base, recorded as a $2,377M credit to additional capital rather than a cash outflow [40]. Twenty-three months later, the South32 deed adds approximately 17 million more shares [41]. Pro forma, roughly 281 million shares against 178 million at the end of FY2023: an increase of 58% in four years.
The framework's rule on this point is categorical rather than scaled — a share count that keeps rising through stock compensation or serial acquisitions is treated as disqualifying, because the buyback flywheel that makes a dislocation pay cannot run in reverse. Alcoa's count is rising, and the driver is two stock-funded acquisitions in three years. The fair counter is that neither deal was empire-building into an unrelated business: Alumina Limited bought in the minority of the AWAC assets Alcoa already operated, and the South32 assets are adjacent bauxite, alumina and smelting capacity acquired, in management's account, "at a valuation that is well below replacement cost" [42]. That may make them good acquisitions. It does not make the share count fall.
Management on Buybacks
Brokers have asked in almost every quarter. The answers, in sequence, are consistent and consistently rank repurchases last.
In October 2021, initiating the dividend and a new repurchase authorization, then-CEO Roy Harvey said that "with our current view of the markets and expected cash flows, we believe these programs can be sustained" [43]. On the Q2 FY2022 call in July 2022, at the cycle peak, Harvey reported "$275 million in stock buybacks during the second quarter" and "an additional authorization of $500 million for future stock repurchases" [44].
One year later, with the stock down and the alumina market weak, JPMorgan asked how to think about capital returns and buybacks in the coming quarters. CFO Molly Beerman: "our capital allocation framework remains the same. We position for growth, we manage our portfolio and then we do returns to shareholders, and all of those depend on us having excess cash. So right now in the operating environment, we're going to stay with our dividend… for right now, we have nothing to announce there" [45].
The ranking hardened as the balance-sheet target came into view rather than loosening. On the Q3 FY2025 call in October 2025, Beerman told Jefferies: "We do have a priority to continue to pay down debt. We have notes, the 2027 notes, with $141 million remaining, and on the 2028 notes, $219 million remaining. That will be our first priority. But as we stay within the net debt target, we will certainly be evaluating additional returns to stockholders in parallel with pursuing some growth options" [46].
In January 2026, with the target met, Bank of America asked directly whether a net debt level below $1.5B put buybacks back on the table. Beerman: "we did just get under the target at $1.46 billion… We do expect to generate cash across 2026. And that will be used for additional debt repayments. Recall we still have $219 million on our 2028 notes. We will expect to have excess cash to compete between shareholder returns and value-creating growth opportunities" [47]. CEO William Oplinger added the ordering explicitly: balance sheet first, sustaining capital second, "and then… it's going to be a mix between returns to shareholders and growth" [48].
In April 2026 B. Riley put the question in the framework's own terms — whether buybacks could look less attractive than refining M&A. Oplinger: "The conflict has not changed our capital allocation framework. To reiterate, first and foremost is to sustain the operations that we have… Secondly, it is to maintain a strong balance sheet… Beyond that, we will balance between shareholder returns and growth opportunities" [49]. Ten weeks later the balance resolved: $3.1B of cash to South32, and on the Q2 FY2026 call in July 2026 no analyst asked about buybacks at all. Capital returned to shareholders in the first half of 2026 was $53M of dividend [50].
Insider buying alongside is absent from the record available here. The Form 4 extract covering October 2016 to January 2025 contains eleven open-market purchases in total, all by one director under a 10b5-1 plan between April 2020 and January 2021, in lots of 100 to 400 shares at $7.12 to $17.50 — roughly 2,000 shares in aggregate. Every other acquisition in the file is a grant or an option exercise. The 2026 extract, running 28 January to 22 July 2026, records 32 grants, 16 tax withholdings and one open-market sale — 4,600 shares at $46.82 by the Chief Operations Officer on 22 July 2026. The window from February 2025 to January 2026, which contains the April 2025 trough, is not covered by either extract, so no claim is made about insider behaviour at the low.
Source: the Form 4 extracts in data/insider_transactions (20 October 2016 to 27 January 2025) and data/governance/insider_activity.json (28 January to 22 July 2026).
The Levered Exception
The framework tolerates leverage only where the adjusted yield is very high, around 25–40%, and then only if all three legs hold. None of the three is available here.
The yield leg fails first. Adjusted free cash flow of $526M on an $11.81B market capitalization is 4.45% (Yield); consensus forward yields on the same market cap reach 7.4% in FY2026, 13.3% in FY2027 and a peak of 16.1% in FY2028 (fit_features.consensus_forward_yield). Nothing in the series approaches 25%. The share-count leg fails outright, for the reasons above — the framework's benchmark for this exception is a count roughly halved over ten years, against Alcoa's 46.6% increase in two. The FCF-to-revenue leg is the only ambiguous one: reported free cash flow over consolidated sales is 4.4% in FY2025, 2.7% in FY2022 and negative 4.2% in FY2023, improving but too volatile to describe as stable. Two clear failures and one unproven leg. The exception does not compute, and it is not close enough for the arithmetic to be worth extending.
Float Retirement Arithmetic
fit_features.float_retirement_years returns null, with not_computable recording that "positive latest adjusted FCF and current market cap in the same currency are required" — the same missing stock-compensation series that blocked the adjusted-FCF feature. The arithmetic is nevertheless straightforward from the filed figures.
Market capitalization of $11,813M is fit_features.market_cap.native — 261M shares at the 31 July 2026 close of $45.26. Reported FY2025 free cash flow of $567M is the Statement of Consolidated Cash Flow, operating cash of $1,185M less capital expenditures of $618M [51]. Adjusted FCF deducts $41M of stock-based compensation from the same statement [52]. The FY2028 figure is fit_features.consensus_forward_yield.per_fy.
At the current price, twenty-two and a half years of adjusted free cash flow retire the float. On the single best year consensus forecasts anywhere in the next four, it takes six. The framework's marker for a price making a claim it cannot survive is about three.
Dividend
The dividend is not part of the return case and needs one line. Alcoa has paid $0.10 per share quarterly since November 2021 without interruption, including through the 2023 loss year, totalling $104M in 2025, $89M in 2024 and $72M in 2023 [53]; at $45.26 that is a 0.88% yield, covered 5.1 times by FY2025 adjusted free cash flow, and materially below the roughly 4% level at which the framework's dividend-safety test engages.
Promise Against Delivery
Six commitments made two to four years ago, checked against what happened.
Sources, by row: October 2021 capital-returns commentary [54] against Note N [55]; the July 2022 authorization [56] against Note N [57]; the San Ciprian restart commitment [58] against the FY2025 Business Update [59]; the profitability program and Kwinana target [60]; the delevering commitment [61] against the FY2025 outcome [62], with total debt falling from $2,595M to $2,448M across the Note M short-term and long-term debt tables [63]; the Kwinana closure charge [64].
The financial commitments were kept and the operational ones missed for reasons that are visible in the record. The $645M profitability program was exceeded ahead of schedule, reaching $675M by 31 December 2024 [65]; the net debt target announced in early 2025 was hit by the end of the same year [66]. The San Ciprián slip has a documented external cause — the restart was paused in April 2025 following a widespread power outage across Spain and resumed in July 2025 [67] — though the original January 2024 date had already been substantially missed before the blackout. The Kwinana target failed on the way to something worse: management flagged in January 2025 that "the Kwinana curtailment has been slow to deliver savings due to high transition and holding costs" [68], and the refinery was permanently closed in 2025 with $895M of restructuring and related charges [69]. Management flagged the Australian mine-approval timing slip on the July 2026 call before it became a miss, describing it as "a matter of timing rather than outcome" [70].
On the ownership side, all directors, nominees, named executive officers and executive officers as a group — seventeen individuals — beneficially owned 647,329 shares at 1 March 2026, or 1,124,521 including underlying stock units, against 263,862,492 shares outstanding: under half a percent of the company [71]. The CEO's 181,246 beneficial shares plus 177,077 underlying units come to roughly $16M at $45.26 [72]. Guidelines require the CEO to hold six times base salary and other named officers two to three times, and all named officers had satisfied them at 31 December 2025 [73]; non-employee directors must hold at least $750,000 of stock until retirement from the board [74]. Short selling, hedging, pledging and margin accounts are prohibited [75].
That is not a promotional pattern. The claims made are specific and quantified, the misses are disclosed early and in the same numbers used to set the targets, ownership requirements are real and met, and the compensation structure ties performance units to relative total shareholder return and return on equity over three-year periods [76]. The one commitment that was made to shareholders and quietly not honoured is the repurchase authorization — four years live, nothing bought, and the question no longer asked on the calls. What would change this read is a single quarter of executed repurchases at a price below the blended $55.32 already paid; what would confirm it is the AliGroup close in the first half of 2027 followed by another two years of debt paydown.
What would close the gap
Alcoa's gap closes on the aluminum price, not on a repricing calendar. At the 4.2x EV/EBITDA the June-July fall implies, recovering the $10.1 billion of market value lost needs roughly $2.4 billion more EBITDA — about $1,150/mt on the LME, some 24% above the second quarter's realized $4,752/mt. Dated catalysts exist: the 15 October print, the South32 shareholder vote, a first-half-2027 close. None of them sets that price.
The fall was the give-back of a metal-price spike rather than a cut to a contracted revenue stream, and management says so directly. On the 16 July call the CEO described the LME as having "returned to pre-Middle East conflict levels following a macro-driven correction" while the fundamentals behind the run-up had not moved: the global market still expected to be in deficit for the year, inventories low, a meaningful amount of Middle East production offline on uncertain timelines [1]. Asked what had driven the retreat, his answer was one word: "The first answer is sentiment", with between three and 3.5 million metric tons of capacity still offline within the Strait of Hormuz [2]
That makes the re-rating mechanism a price, and a price can be sized. Alcoa's own 2026 sensitivity table puts a $100/mt move in the LME at $237 million of annual segment adjusted EBITDA, against which the Section 232 tariff line moves $30 million the other way — a net $207 million per $100/mt [3].
Market value lost, 2 Jun to 31 Jul ($M)
Implied EV / FY27e EBITDA
EBITDA needed to close it ($M)
Implied LME move ($/mt)
Sources: derived — market value on 261.0 million shares (fit_features.market_cap.shares) at closes of $83.79 and $45.26; adjusted net debt of $1.4 billion at 30 June 2026 [4]; consensus FY2027 EBITDA of $3,140.5 million from ten estimates; LME sensitivity from the 2Q26 presentation [5].
The workings: market capitalization fell from 261.0m x $83.79 = $21,869M on 2 June to 261.0m x $45.26 = $11,813M on 31 July, a loss of $10,056M. Adding $1,400M of adjusted net debt gives an enterprise value of $13,213M, or 4.21x the $3,140.5M consensus FY2027 EBITDA. Restoring $10,056M of equity value at that multiple takes $10,056 / 4.21 = $2,389M of additional EBITDA, which at $207M per $100/mt is +$1,154/mt — 24.3% above the $4,752/mt Alcoa realized on primary aluminum in the second quarter [6]. On the gross $237M sensitivity the requirement is +$1,008/mt, or 21.2%.
Cost normalization is real and is rolling off on a known schedule, but it is an order of magnitude too small to be the mechanism. The Pinjarra refinery's oxalate outbreak and gas-supply curtailment cost $30 million in the second quarter and the whole $30 million is recovered in the third-quarter guide; diesel and fuel oil turn $5 million favorable; carbon costs turn $15 million unfavorable on the same lag; caustic soda, which spiked in the second quarter, has already corrected and reaches the profit and loss in the fourth quarter on a six-month lag [7] [8]. Section 232 tariff costs on Canadian metal fall about $10 million sequentially, on volume rather than rate [9]. Netted, the company guides the Alumina segment $10 million favorable and Aluminum flat for the third quarter. Sustained cost relief of $50 million a quarter would be $200 million a year, worth $842 million of enterprise value at 4.21x — 8.4% of the gap.
The acquisition carries the clearest dated path and the clearest offset. Alcoa expects to close its purchase of South32's bauxite, alumina and aluminum interests in the first half of 2027, subject to a South32 shareholder vote, regulatory approvals and customary conditions, with no financing or diligence conditions outstanding [10]. Management identified approximately $900 million of net-present-value synergies including roughly $50 million of run-rate cost savings in the first year after closing, and expects the deal to be accretive to earnings per share and free cash flow immediately after close [11]. Against that: the consideration includes roughly 17.0 million new shares and $3.1 billion of cash, a ticking fee of $80 million to $100 million running from the shareholder vote, and a contingent value right that pays South32 22.5% of acquired-production revenue above an aluminum strike of $2,825/mt in CY2027 — a strike the second quarter's $4,752/mt realized price already clears — capped at $750 million over four annual periods [12]. Part of the metal-price upside that would drive the re-rating is contracted away before it reaches shareholders.
The last candidate is an overhang closing rather than an earnings event: the Western Australia mining approvals. Ministerial approval had been guided for the end of 2026; after five weeks in Australia the CEO said that "while my confidence in the outcome remains unchanged, the timing could extend beyond our original expectations", with contingency built for a six-month delay carrying no impact on supply, quality or cost, and secondary plans beyond that involving modified mining and refinery flow rates [13].
The dated calendar
Sources: earnings date from the run's earnings calendar [14]; vote timing, ticking fee, caustic lag, approvals, San Ciprian and asset monetization from the Q2 FY2026 call [15] [16] [17] [18] [19]; close timing from the 2Q26 presentation [20].
The fourth-quarter date is not yet scheduled; Alcoa has released fourth-quarter results in the second half of January in each of the last three years, and the CEO closed the July call saying the company would next speak in October [21]. The presentation's ticking-fee illustration assumes a 1 November 2026 vote and a first-half-2027 close [22], and the transaction page carries "1H27" as the target close with post-close leverage of about 2.0x and affirmed credit ratings from both major agencies [23].
Mechanisms not in motion
Two of the standard re-rating routes are running backwards here.
The denominator is growing, not shrinking. The July 2022 repurchase authorization of $500 million was still entirely unused at 31 December 2025 [24], and Alcoa repurchased no shares in April, May or June 2026, leaving the full $500 million available [25]. Shares outstanding were 263,909,445 on 27 July 2026 [26], against 178 million at the end of FY2023 (fit_features.share_count_trend) — 48% more shares in under three years, with roughly 17.0 million more contracted for the acquisition. Spending the whole authorization at $45.26 would retire 11.0 million shares, 4.2% of the count; management has instead committed $3.1 billion of cash to the acquisition and set consideration to hold post-close leverage at about 2.0x. The capital-allocation reading belongs to Self-Help.
Guidance is not resetting against a low bar; it is stepping down. Consensus adjusted EPS runs $1.66 for 3Q26, $1.61 for 4Q26, $1.50 for 1Q27 and $1.36 for 2Q27 against the $2.12 Alcoa printed in the second quarter. The FY2027 consensus EPS was cut from $7.52 thirty days ago to $5.93 today, a 21.1% reduction, though it remains 13.4% above the $5.23 of 180 days ago. The surprise record has turned with it: minus 9.6% in 1Q26 and minus 3.2% in 2Q26, against a plus 24.7% beat in the quarter before them [27].
Base rates from this record
Alcoa Corporation has a nine-year-nine-month price record: it became an independent company on 1 November 2016. The vendor series carries the AA ticker back to 1990, but before that date the ticker belonged to a larger predecessor — the separation created both Alcoa Corporation and Arconic — and the series is not adjusted for it, so pre-2016 episodes are context rather than a base rate for this entity.
Source: derived from the run's daily closing price series, 1 November 2016 to 31 July 2026; drawdown measured against the highest close since the separation.
Two falls of 30% or more from a running peak have occurred in that record. The April 2018 peak of $60.23 fell to $5.48 on 20 March 2020, a decline of 90.9% over 701 days, and regained the peak on 3 January 2022 — 654 days back, 1,355 days top to bottom and back, or 3.7 years. The March 2022 peak of $95.06 fell to $22.57 on 8 April 2025, a decline of 76.3% over 1,111 days, and has not been regained: at $45.26 the stock sits 52.4% below it, 1,590 days after the peak.
Measured against the trailing one-year high — the frame that fits a live drawdown better than an all-time peak — the stock has entered a state of 40% or worse four times in nine years and nine months, roughly once every 29 months.
Source: derived from the run's daily closing price series; an episode starts on the first close 40% or more below the trailing 252-session high and ends on the first close back within 20% of it. The deepest point is the day of the largest shortfall against the trailing high, which is not always the lowest close of the episode — the 2022 episode closed at $23.41 on 23 October 2023 against a trailing high that had itself fallen by then.
Across the 2,198 sessions with a full trailing year behind them, 919 — 42% — were spent 40% or more below the trailing one-year high. Forward returns measured from every one of those days: median minus 18.1% over twelve months, 0.0% over eighteen months and plus 19.4% over twenty-four months, with means of plus 40.9%, plus 79.6% and plus 122.4%. The prior one-year high was regained within eighteen months on 22% of those days and within twenty-four months on 33%. The gap between median and mean is the 2020-22 recovery, when the stock rose from $5.48 to $95.06 in 734 days. The caveat matters: these are overlapping daily observations drawn from three completed episodes, so the effective sample is three, not 919.
The current episode has a close precedent fifteen months old. The April 2025 fall reached 52.4% below the trailing high and was out of that state in 200 days; the stock then ran from $22.57 to $83.79 by 2 June 2026, a gain of 271% in 420 days, before giving back 46%.
The 18-month read
On this record, re-recognition within eighteen to twenty-four months is a real possibility rather than the base case. Three completed episodes took 200, 694 and 768 days from entering the 40%-below state to escaping it, and 195, 241 and 550 days from the deepest point; the median eighteen-month forward return from that state is 0.0%, and the prior high came back inside eighteen months about one time in five. The mechanism points the same way from the other direction: the corporate calendar contains a shareholder vote, a mining approval and a closing, and none of them sets the aluminum price that has to move 21% to 24% to close the gap at a constant multiple.
The strongest fact against that read is management's own: a meaningful amount of Middle East production remains offline with uncertain timelines, the market is expected to be in deficit this year and inventories are low [28]. On the CEO's own count that offline capacity is between three and 3.5 million metric tons within the Strait of Hormuz [29]. That is the same set of facts that carried the stock 271% in the fourteen months to June 2026 — this name does not need years to travel, only a price.
What would falsify the read: the Strait of Hormuz capacity returning to production, removing the deficit the recovery depends on; the Western Australia ministerial approval slipping past its six-month contingency into the scenarios that modify mining and refinery flow rates; or the acquisition failing to close in the first half of 2027. Those thresholds carry through to the falsifier ledger on Fit.
What consensus expects
Mean target, 12 estimates
Median target
Lowest target on the street
Highest target
Source: analyst price targets as compiled for this run [30]; the count of twelve contributing estimates is from the run's estimates feed.
The sell side has not capitulated. Every one of the twelve published targets sits above the last close: the lowest, $49.70, is 9.8% above $45.26, and the mean of $62.98 is 39.1% above it. Ratings stand at seven buy, five hold, one strong sell and no sells across thirteen firms; a month earlier they were one strong buy, nine buy and three hold [31]. Buy-side ratings went from ten to seven and one strong sell appeared — a trim, not a capitulation. The recovery this tab is asked to time is already inside the street's price targets.
Sources: printed figures are Adjusted EBITDA excluding special items from the 2Q 2026 presentation reconciliation [32]; forward quarters are consensus means from the run's estimates feed, four to seven contributors per quarter.
Consensus does not model a recovery in printed quarterly numbers inside its own published horizon. Adjusted EBITDA of $901 million in the second quarter is followed by $721 million, $780 million, $743 million and $693 million through to the second quarter of 2027, the last quarter carried. The recovery consensus does hold is annual and in cash: free cash flow of $880.0 million for FY2026, $1,565.2 million for FY2027 and $1,900.7 million for FY2028 — 7.45%, 13.25% and 16.09% on the current market capitalization, per fit_features.consensus_forward_yield. What those figures survive once the framework's own deductions are applied is worked in Yield.
The candidate quarter, then. The nearest dated print is 15 October 2026, carrying $1.66 of adjusted EPS against minus $0.02 in the third quarter of 2025 [33]. That is a large year-on-year step and a sequential fall, so it tests whether June's price reset is already in the numbers rather than whether a recovery has begun. The first period in which consensus itself shows a step change is FY2027 free cash flow, 77.9% above FY2026, which prints with full-year results around late January 2028 — roughly eighteen months out, at the far edge of the instrument durations that exist on this name.
Instrument facts
Listed options on Alcoa common stock exist with expiries beyond twelve months. The full ladder retrieved on 3 August 2026 (stockoptionschannel.com) runs weekly through 18 September 2026, then 16 October 2026, 18 December 2026, 15 January 2027, 19 March 2027, 17 June 2027 and 21 January 2028. The longest listed expiry, 21 January 2028, is 536 to 538 days out depending on the source's as-of stamp — about 17.6 months, clearing the framework's twelve-month line and falling just short of its eighteen-month preference.
Source: barchart.com per-expiry option statistics for AA, retrieved 3 August 2026; no filing page backs these figures and they are recorded as uncited in this tab's manifest.
The dated volatility readings, both as of 31 July 2026, are a 30-day mean implied volatility of 53.80% and a 120-day mean of 56.19% (alphaquery.com, retrieved 3 August 2026). Barchart's 21 January 2028 at-the-money reading of 59.38% sits against a historic volatility of 48.64% and an IV rank of 28.74%. Realized volatility computed from the run's own daily closes over the last 252 sessions is 55.0% annualized, and 55.6% across the whole Alcoa Corporation record, so the long-dated implied level carries a modest premium to what this stock has actually delivered. Against the framework's reference lines — up to roughly 50 to 55 acceptable, 60 to 70 elevated — the 30-day reading sits inside the acceptable band and the long-dated at-the-money readings of 57% to 59% sit above it and below the elevated band.
Open interest at the longest expiry totals 25,607 contracts, about 2.56 million shares or 1.0% of the 263,909,445 shares outstanding [34]; the January 2027 line carries 54,845 contracts and the June 2027 line 5,034. Depth is concentrated at the January expiries and thin in between.